Bollinger Bands: Bollinger Bands is a commonly used technical indicator, which consists of three lines, the upper and lower lines, which can be seen as the price of the pressure line (i.e. the upper rail) and the support line (i.e. the lower rail). There is a moving average line (i.e. the middle rail) between the two lines, and the Bollinger channel formed by the three lines changes according to the price trend.
Bollinger Bands have four main functions
1. Bollinger Bands can represent the positions of support and pressure;
2. Bollinger Bands can show bullish power and hollow power;
3. Bollinger Bands can show a trend;
We use the Bollinger Bands as a unilateral trend. Unilateral rise, unilateral fall, or sideways fluctuations
Normally, in the Bollinger Bands chart, the upper, middle and lower Bollinger Bands will support the price, or function as pressure. When the upper, middle and lower tracks of the Bollinger Bands are all pointing upward, there is no doubt that the price should rise. Our trading philosophy is to do more bargain hunting
When the mouths of the Bollinger track and the middle track are both pointing downward, what does this prove? To prove that the market is going to fall unilaterally, then our trading idea is to short at highs. In other words, we usually judge whether it is up or down, just by looking at whether its mouth is up or down, then it's ok. Then, in addition to rising and falling, the Bollinger track will run horizontally.
When the market ends horizontally, we call it closing. It must be after the volume on one side, that is, after the opening volume, that it will enter the closing. When closing, you will find that the three lines on the Bollinger track are flat, and the upper middle track and the lower third track are also flat, which is horizontal consolidation.
4. Bollinger Bands have channel function.
Bollinger Bands indicator buy and sell signals
(1) When the trend crosses the downward line from bottom to top, it can be regarded as a buy signal.
(2) When the price crosses the middle track from bottom to top, it is a signal to increase buying.
(3) This is a volatile market, and prices fluctuate between the middle track and the Shanghai track. You can wait and see.
(4) The price runs between the middle track and the upper track for a long time, and the downward drop of the middle track is a sell signal.
(5) The downward fluctuation of prices between the middle track and the lower track is a bad market and is not conducive to long-term investors.
(6) After a long period of sharp decline, the middle track of Bollinger Bands is flat. Within two or three days, its rising turning point and price are above the middle track. At this time, the price pulls back, and its lowest point is often the breakpoint for moderate low buying.
(7) For a bullish market running between the middle track and the upper Bollinger track, you can use low-buy to open a position near the middle track.
(8) Prices often move within the Bollinger Bands channel. Once the channel is broken, trading volume will be released. If it returns to the channel, it also means that the market has reached a turning point or a correction.
The relationship between K-line and Bollinger upper, middle and lower lines
When the K line breaks through the Bollinger Bands from the middle line of the Bollinger Bands and the neutral line below, it indicates that the strong characteristics of the price begin to appear. If the trading volume can be effectively enlarged, it is a good buying point.
When the K-line breaks through the upper and lower Bollinger bands from above the middle track of the Bollinger bands, it indicates that the strong characteristics of the price have been established and the price may soar in the short term.
When the K line breaks through the upper track of the Bollinger Bands, its movement direction continues to move upward. If the movement direction of the three Bollinger Bands also moves upward at the same time, it indicates that the characteristic foundation of the market is strong and the price still has room to rise in the short term. Don't consider buying before the price starts to turn downward. This can be seen in many markets. Generally, the price breaks through the upper track with great pressure. On the second day, the Yin line falls into the upper track of the Bollinger Bands, which means that the price is under great pressure. If the price has risen sharply in the previous period, it should be eliminated decisively.
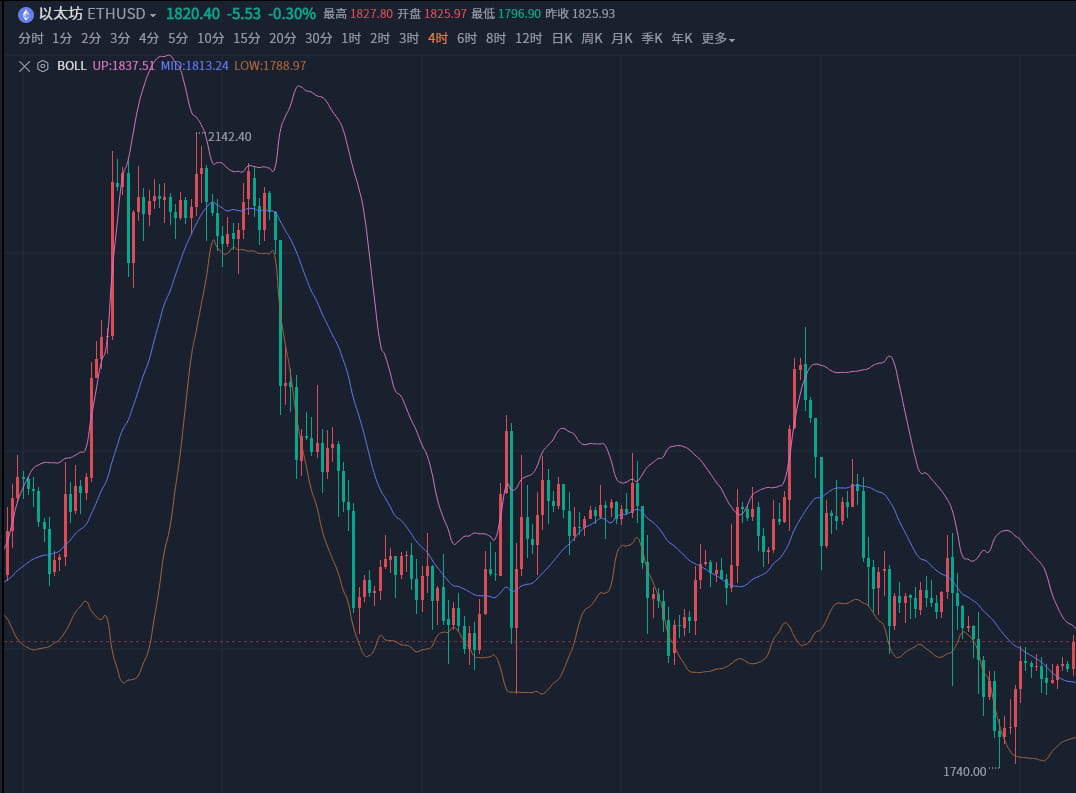
Generally speaking, investors like to use trends and shocks to describe the market. If the Bollinger Bands chart is used to describe the market, it can be summarized by closing and opening. If the opening is in the same direction as the three tracks, it can be summarized as a trend market; if it is closed, it can be summarized as a shock market. The above Bollinger Bands diagram is for your reference.