BTC price is attempting to rebound, while EOS, STX, IMX, and MKR are starting to flash bullish signals.

The U.S. stock market has made a strong recovery this week, but Bitcoin has failed to follow suit. This means that cryptocurrency investors are staying away, possibly worried about the ongoing problems at Silvergate Bank. These concerns may be the reason why the total cryptocurrency market value has dropped to nearly $1 trillion.
Behavior analytics platform Santiment said in a report on March 5 that “bearish sentiment has increased significantly,” according to their social trend chart comparing bullish and bearish words. However, the company added that “this overwhelming bearish sentiment could lead to a rebound to silence critics.”
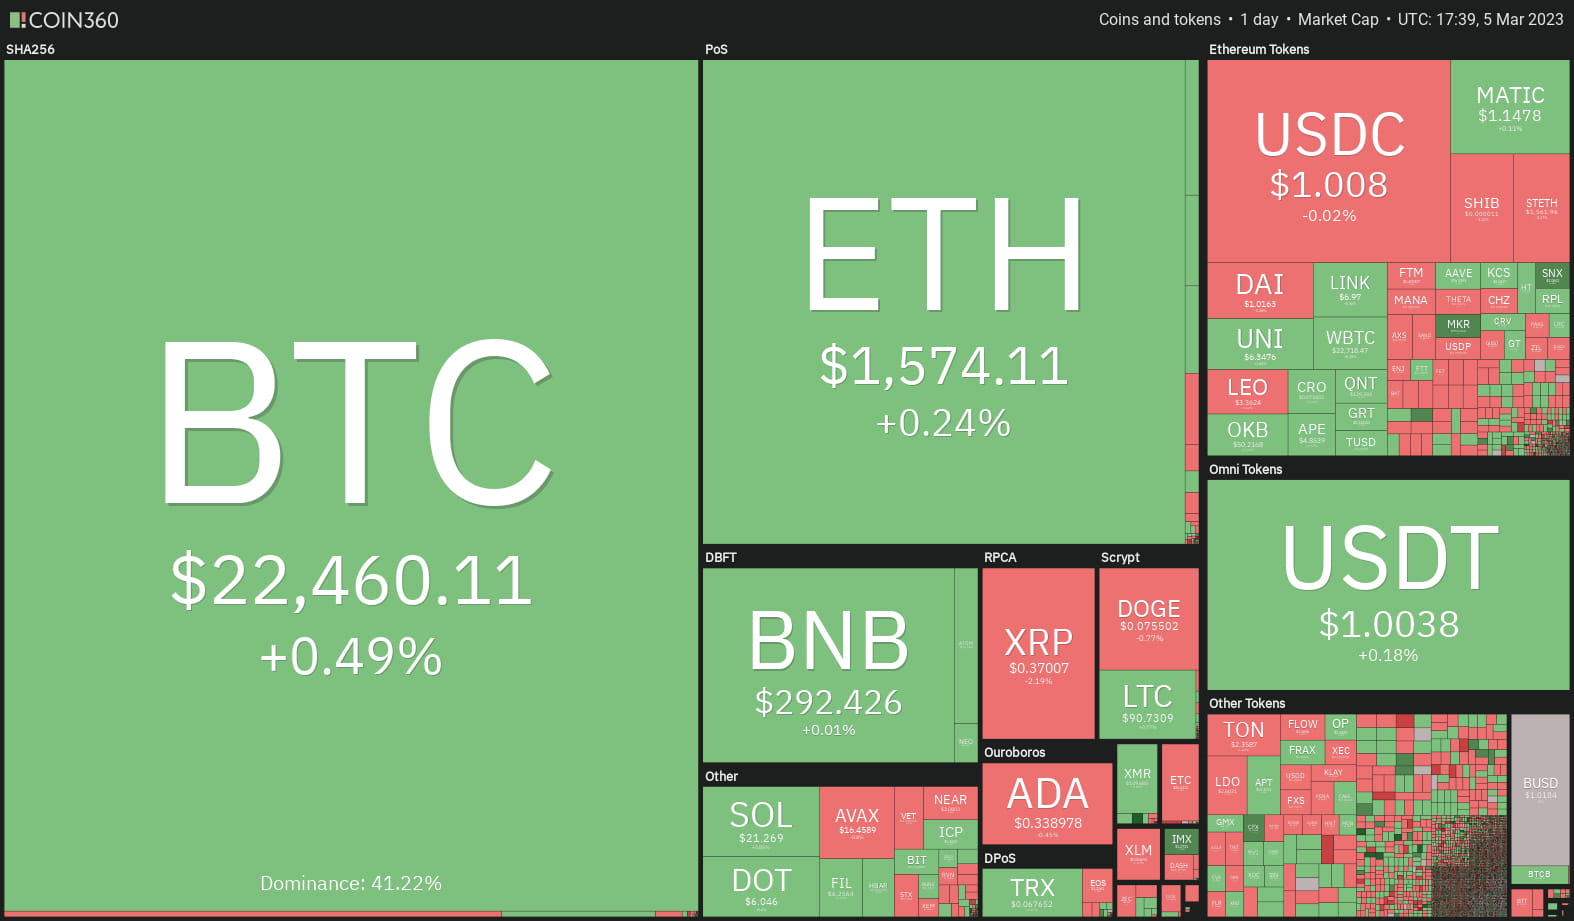
Another short-term positive for the crypto market is the weakness in the US dollar index (DXY), which has fallen by 0.70 in the past seven days. This suggests that the crypto market may attempt a recovery in the coming days. As long as Bitcoin remains above $20,000, some altcoins may outperform the broader market.
Let’s examine Bitcoin’s chart and four altcoins that have shown promise recently.
Bitcoin/USDT
Bitcoin broke below the $22,800 support on March 3. Buyers are trying to push the price back above the breakdown level on March 5, but the long wicks on the candlesticks suggest that the bears are trying to turn $22,800 into resistance.
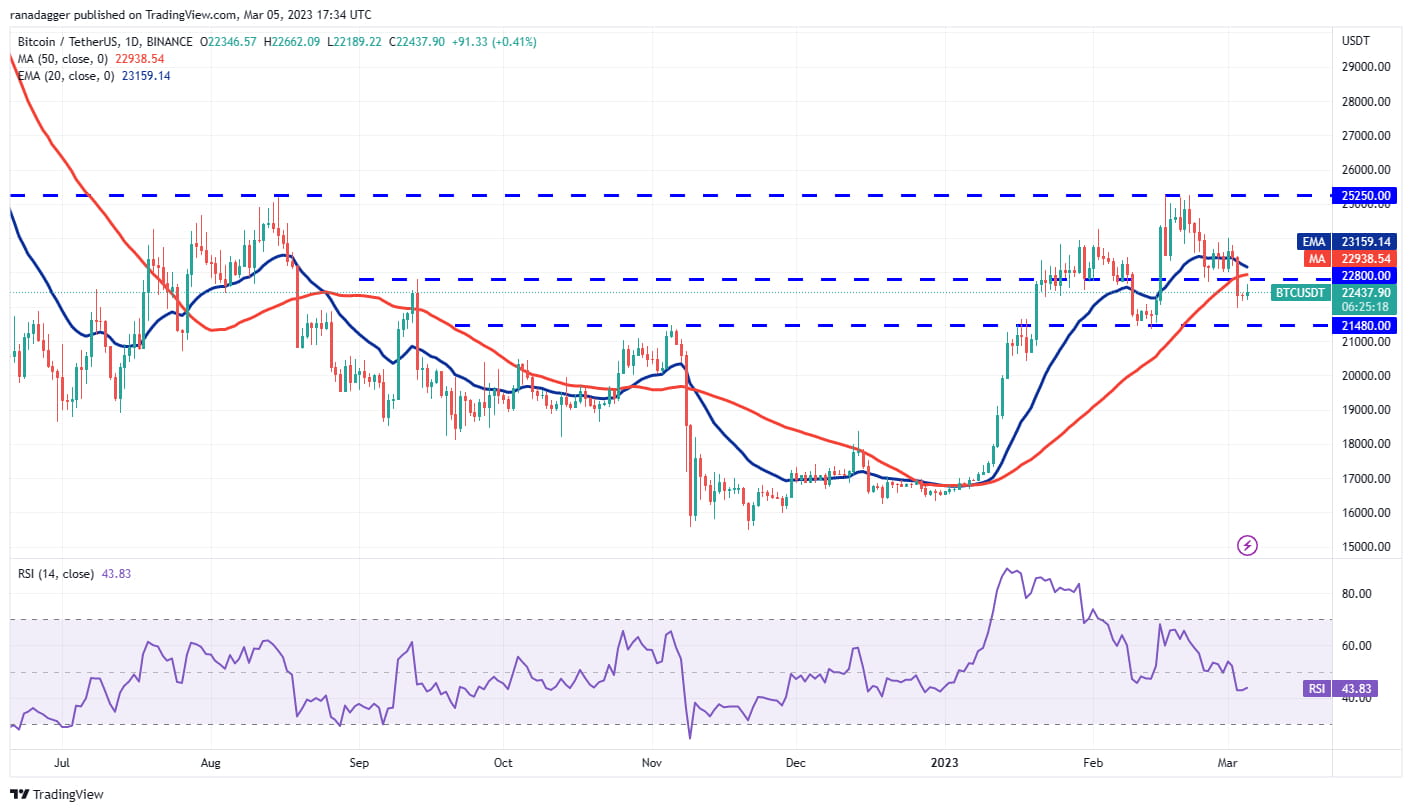
The 20-day exponential moving average ($23,159) has started to turn down and the relative strength index (RSI) is below 44, which suggests that bears are trying to consolidate their positions. The sellers will try to sink the price below the support at $21,480. If they succeed, the BTC/USDT pair is likely to retest the important support at $20,000.
If the bulls want to arrest the downside, they will have to push the price above the 20-day EMA quickly. Such a move will indicate aggressive buying at lower levels. The pair could then move up to $24,000 and above it to $25,250. A breakout of this resistance will indicate a potential trend change.
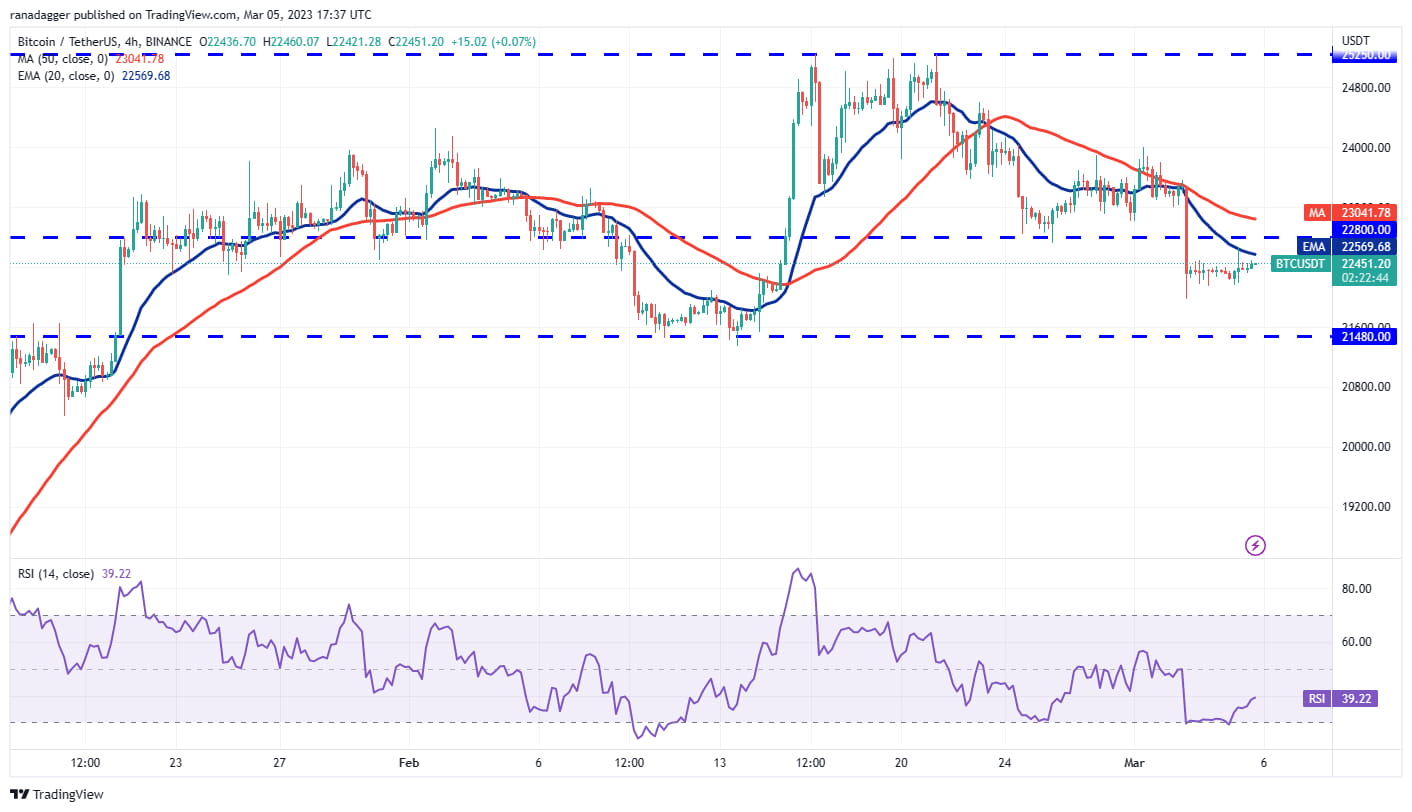
The moving averages are pointing down on the four-hour chart, and the RSI is close to 39. This suggests that bears have the upper hand. If the price turns down from the 20-day EMA and breaks below $21,971, the pair is likely to retest the $21,480 support.
Conversely, if the bulls push the price above the 20-EMA, it will indicate that the bears might be losing their control. The pair might then climb up to the 50-day simple moving average. This is an important level for the bears to defend as a break above it could open the doors for a rally to $24,000.
EOS/USDT
EOS broke the important resistance of $1.26 on March 3 but the bulls could not sustain the higher levels. However, a positive sign is that the price did not dip below the 20-day EMA ($1.17).
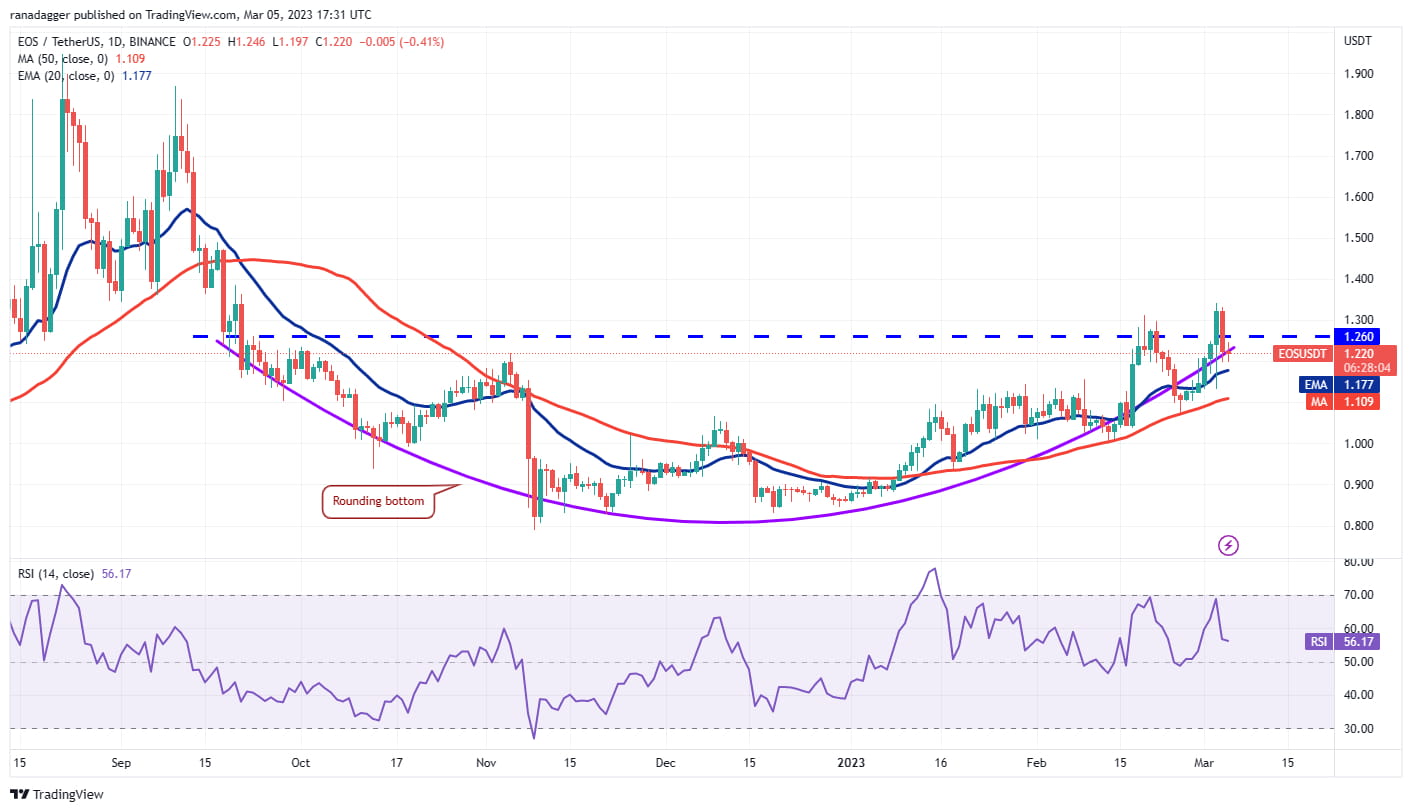
The gradually upsloping moving averages and the RSI in the positive zone suggest that bulls have the upper hand. The EOS/USDT pair has formed a rounding bottom pattern and will close above the $1.26–$1.34 resistance zone on a breakout. This reversal setup has a target objective of $1.74.
The important support to watch on the downside is the 50-day SMA ($1.10). Buyers have not allowed the price to fall below this support since January 8, so a break below this support could accelerate the sell-off. The next support on the downside is $1 and then $0.93.
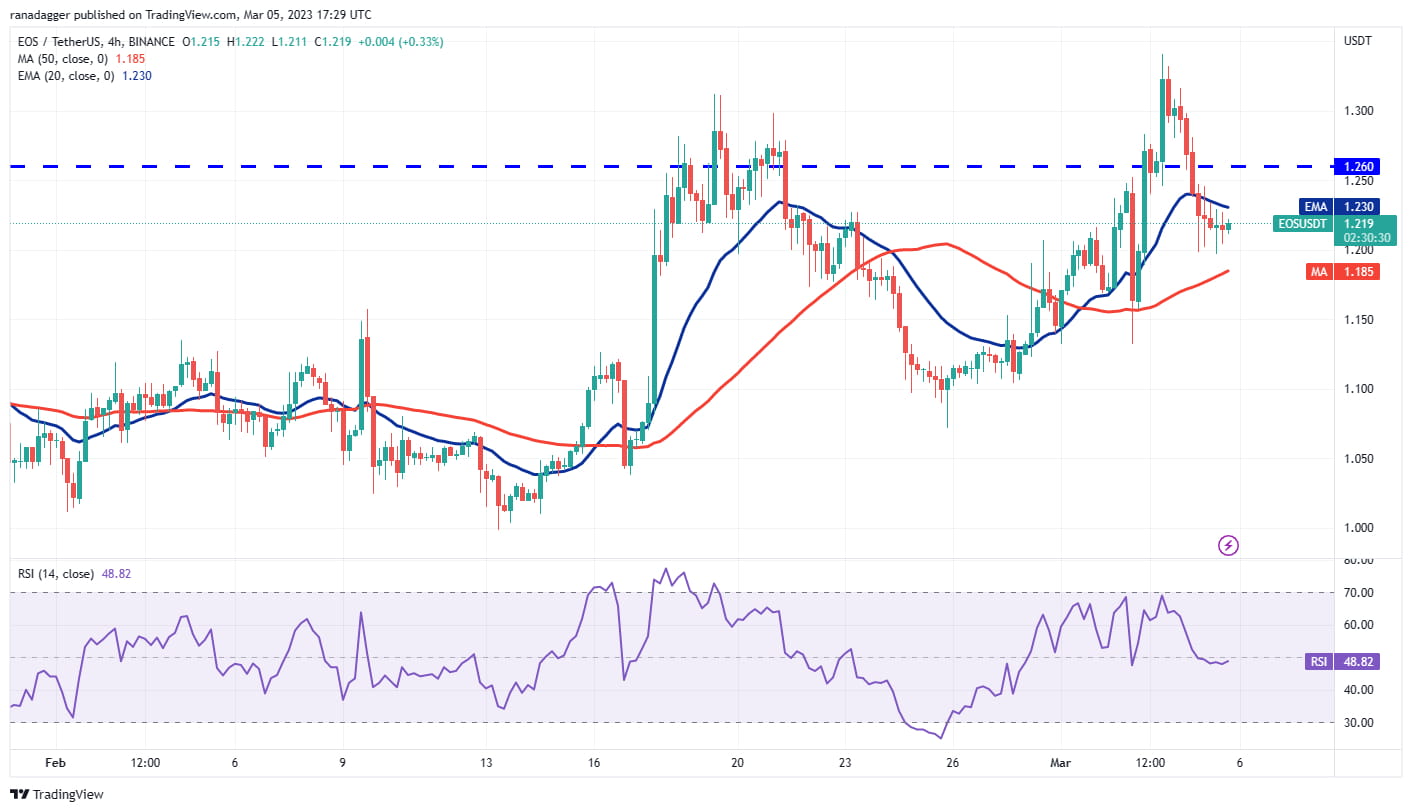
The bears have pulled the price below the 20-EMA, but a small positive is that the bulls have not allowed the pair to sink to the 50-SMA. This shows that lower levels continue to attract buyers. If the price rises above the 20-EMA, the bulls will once again try to clear the $1.26 barrier. If they do, the pair could surge to $1.34.
This positive view might be invalidated in the near term if the price turns down and breaks below the 50-SMA. This could extend the decline to $1.11.
STX/USDT
There was a massive increase from $0.30 on February 17 to $1.04 on March 1, a 246% increase in a short period of time. Typically, a vertical rally is followed by a sharp drop, and that is what happened.
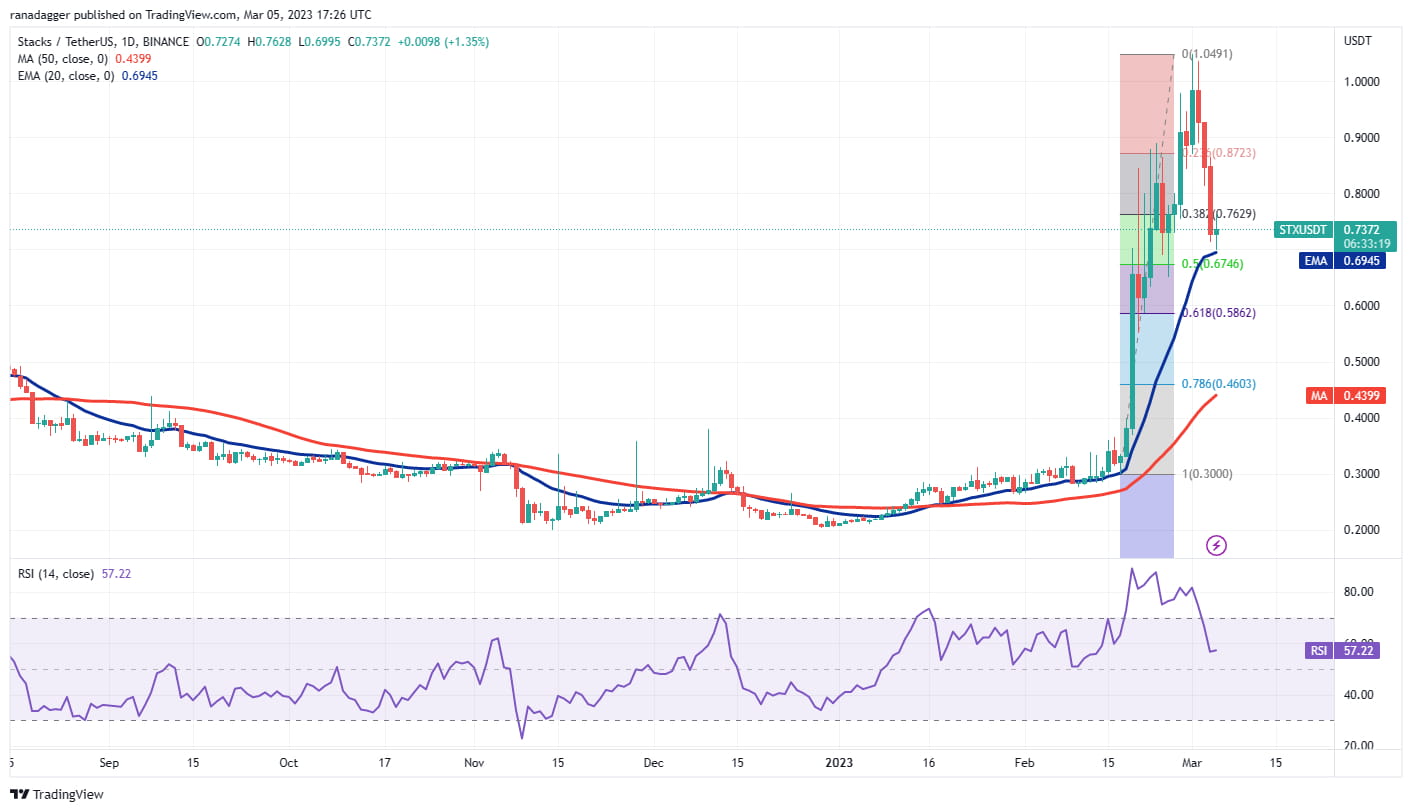
The STX/USDT pair fell to the 20-day EMA ($0.69) and found buying support here. The 50% Fibonacci retracement level of $0.67 is also nearby, so the bulls will try to protect this level. On the upside, the bears will try to rebound from the $0.83 to $0.91 zone.
If the price turns down from this upper zone, the sellers will again try to deepen the correction. If $0.67 is broken, the next support is at the 61.8% retracement level at $0.58.
Contrary to this assumption, if the buyers push the price above $0.91, the pair could move up to $1.04. A breakout of this level will indicate a possible resumption of the uptrend. The pair could then rally to $1.43.
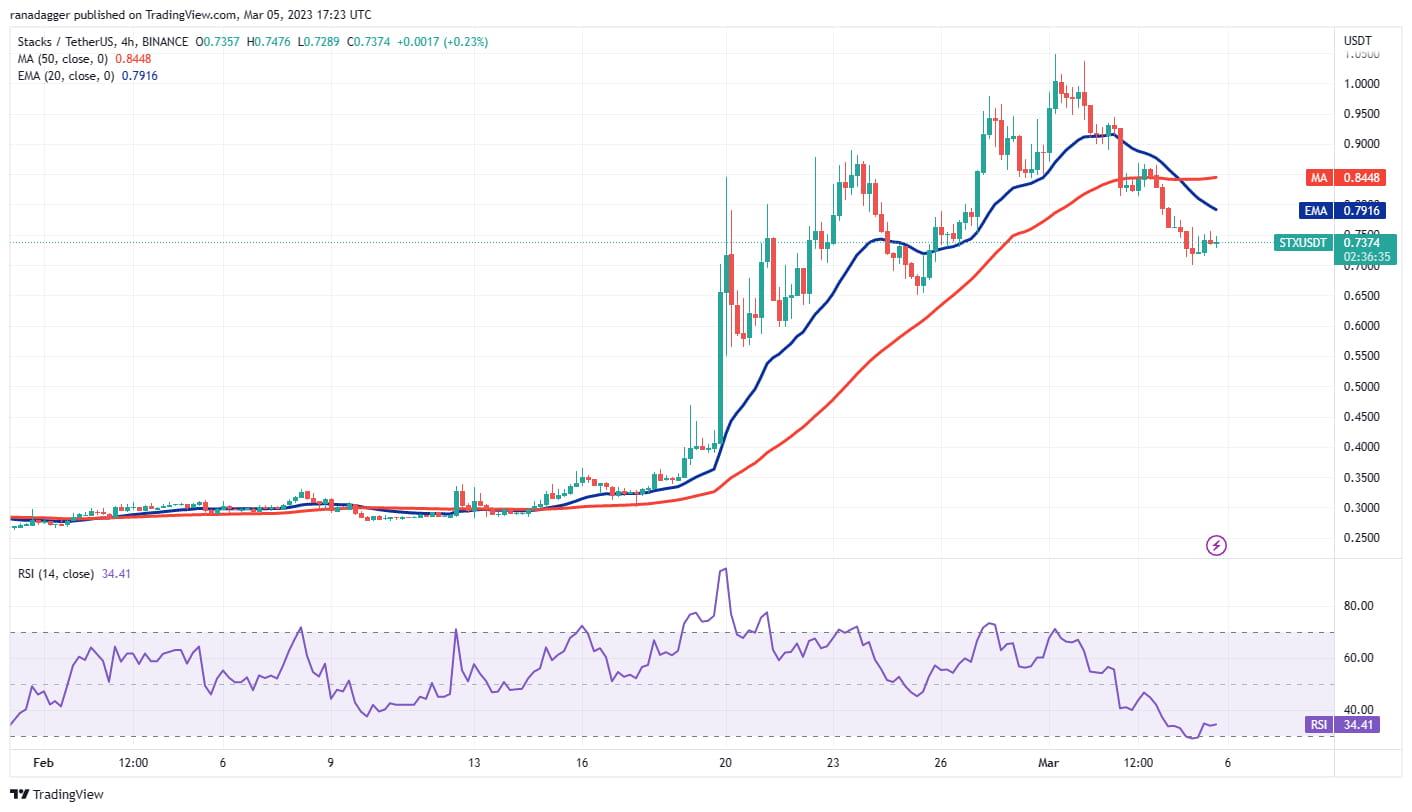
The four-hour chart shows that the 20-EMA is sloping down and the RSI is in the negative zone, which suggests a slight advantage for bears. The sellers are likely to defend the moving averages during the pullback. They will try to maintain their holdings and drop the price to $0.65 and then to $0.56. The bulls will strive to defend this support area.
The first sign of strength will be a breakout and close above the 50-SMA. The pair could then move up to $0.94 and then to $1.04.
IMX/USDT
ImmutableX (IMX) rebounded from the 50-day SMA ($0.88) on March 3 and closed above the 20-day EMA ($1), which shows strong demand at lower levels.
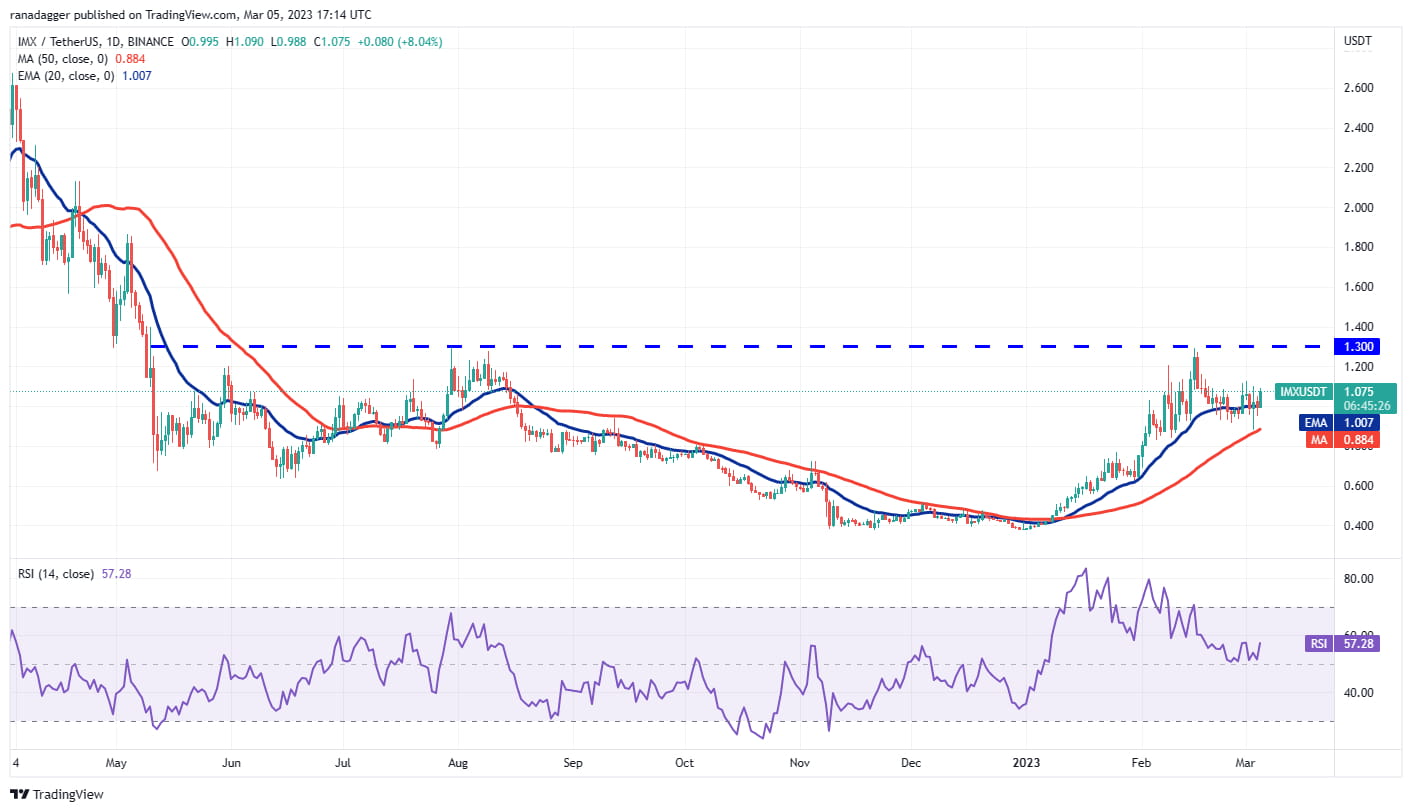
The IMX/USDT pair could rise to $1.12 where the bears will once again try to stall the recovery. If the buyers bulldoze through, the pair is likely to accelerate towards the overhead resistance at $1.30. This is a critical level to watch closely as a breakout and close above it could signal the start of a new uptrend. The pair could then surge to $1.85.
Conversely, if the price turns down from the current levels or from $1.12, it will suggest that the bears have not given up yet. The sellers will then once again try to sink the pair below the 50-day SMA and gain the upper hand. If they succeed, the pair can drop to $0.63.
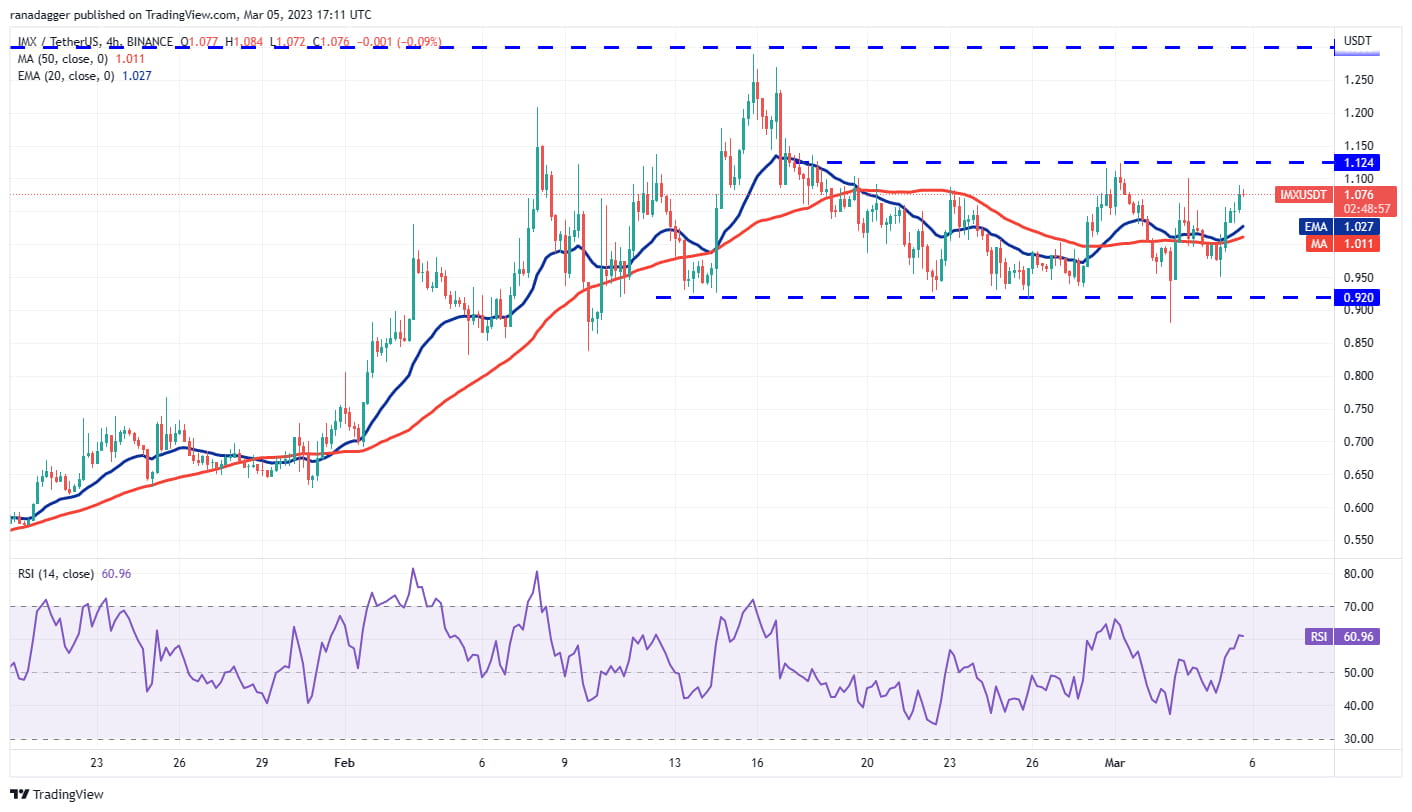
The four-hour chart shows that the price is fluctuating between $0.92 and $1.12. Typically, within a range, traders buy near support and sell near resistance. Price action within the range can be random and choppy.
If the price rises above the resistance, it will indicate that the bulls are overpowering the bears. The pair could then rally to $1.30. Conversely, if the bears sink the price below $0.92, the pair could turn bearish in the short term. A support on the downside is found at $0.83 and the next support is at $0.73.
MKR/USDT
Maker is attempting to resume its uptrend after a short-term pullback. This shows that market sentiment remains positive and traders view dips as buying opportunities.
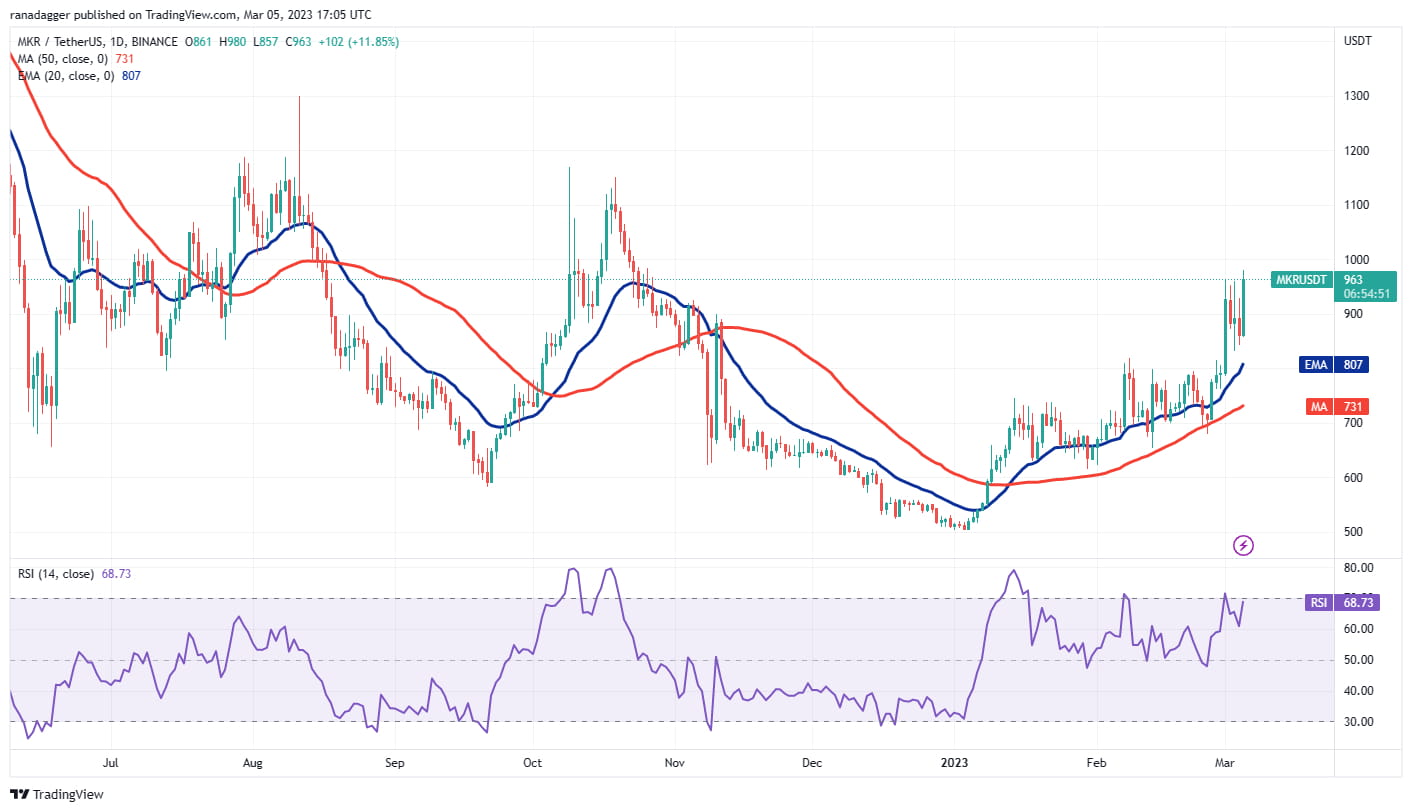
The upsloping moving averages and the RSI in the positive territory suggest that the path of least resistance is to the upside. If the buyers sustain the price above $963, the MKR/USDT pair could start heading towards the $1,150–$1,170 resistance zone.
If the bears want to halt the bullish trend, they will have to sink the price below the 20-day EMA ($807). If they manage to do that, the stops of some short-term traders might get affected. The pair could then drop to the 50-day EMA ($731).
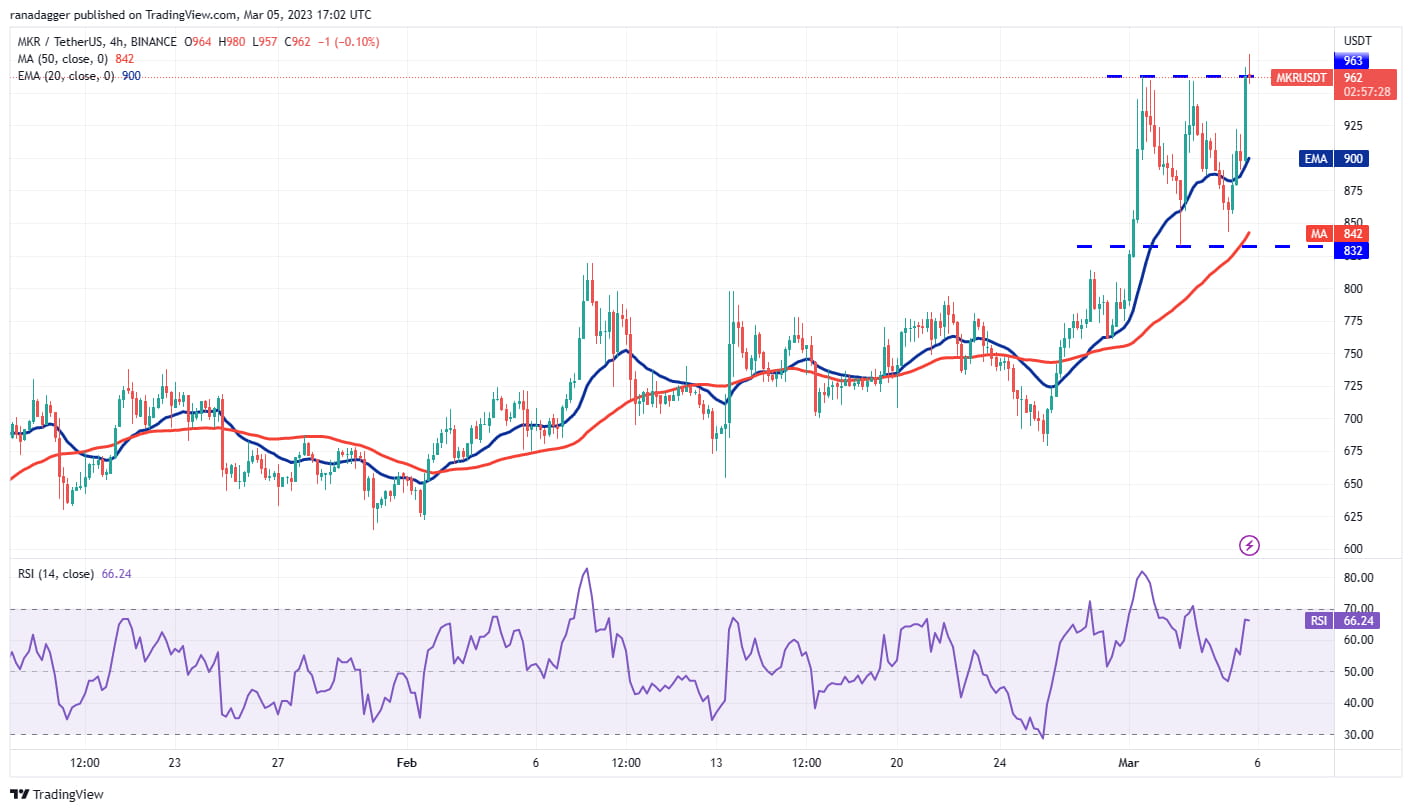
The pair has been trading between $832 and $963 for a while, but the bulls are attempting to push the price above the range. The 20-EMA has turned up and the RSI is in the positive territory, which shows that bulls are in command.
If the price sustains above $963, the pair might attempt a rally towards its target objective of $1,094. On the other hand, if the price declines sharply below $963, it will indicate that the breakout could be a bull trap. This could extend the consolidation for a while.
C3 Tip: The views, thoughts and opinions expressed here are the author's own and do not constitute investment advice or recommendations. Every investment and transaction involves risk.