🔥🔥🚀$RNDR price analysis under current market data. 🚀
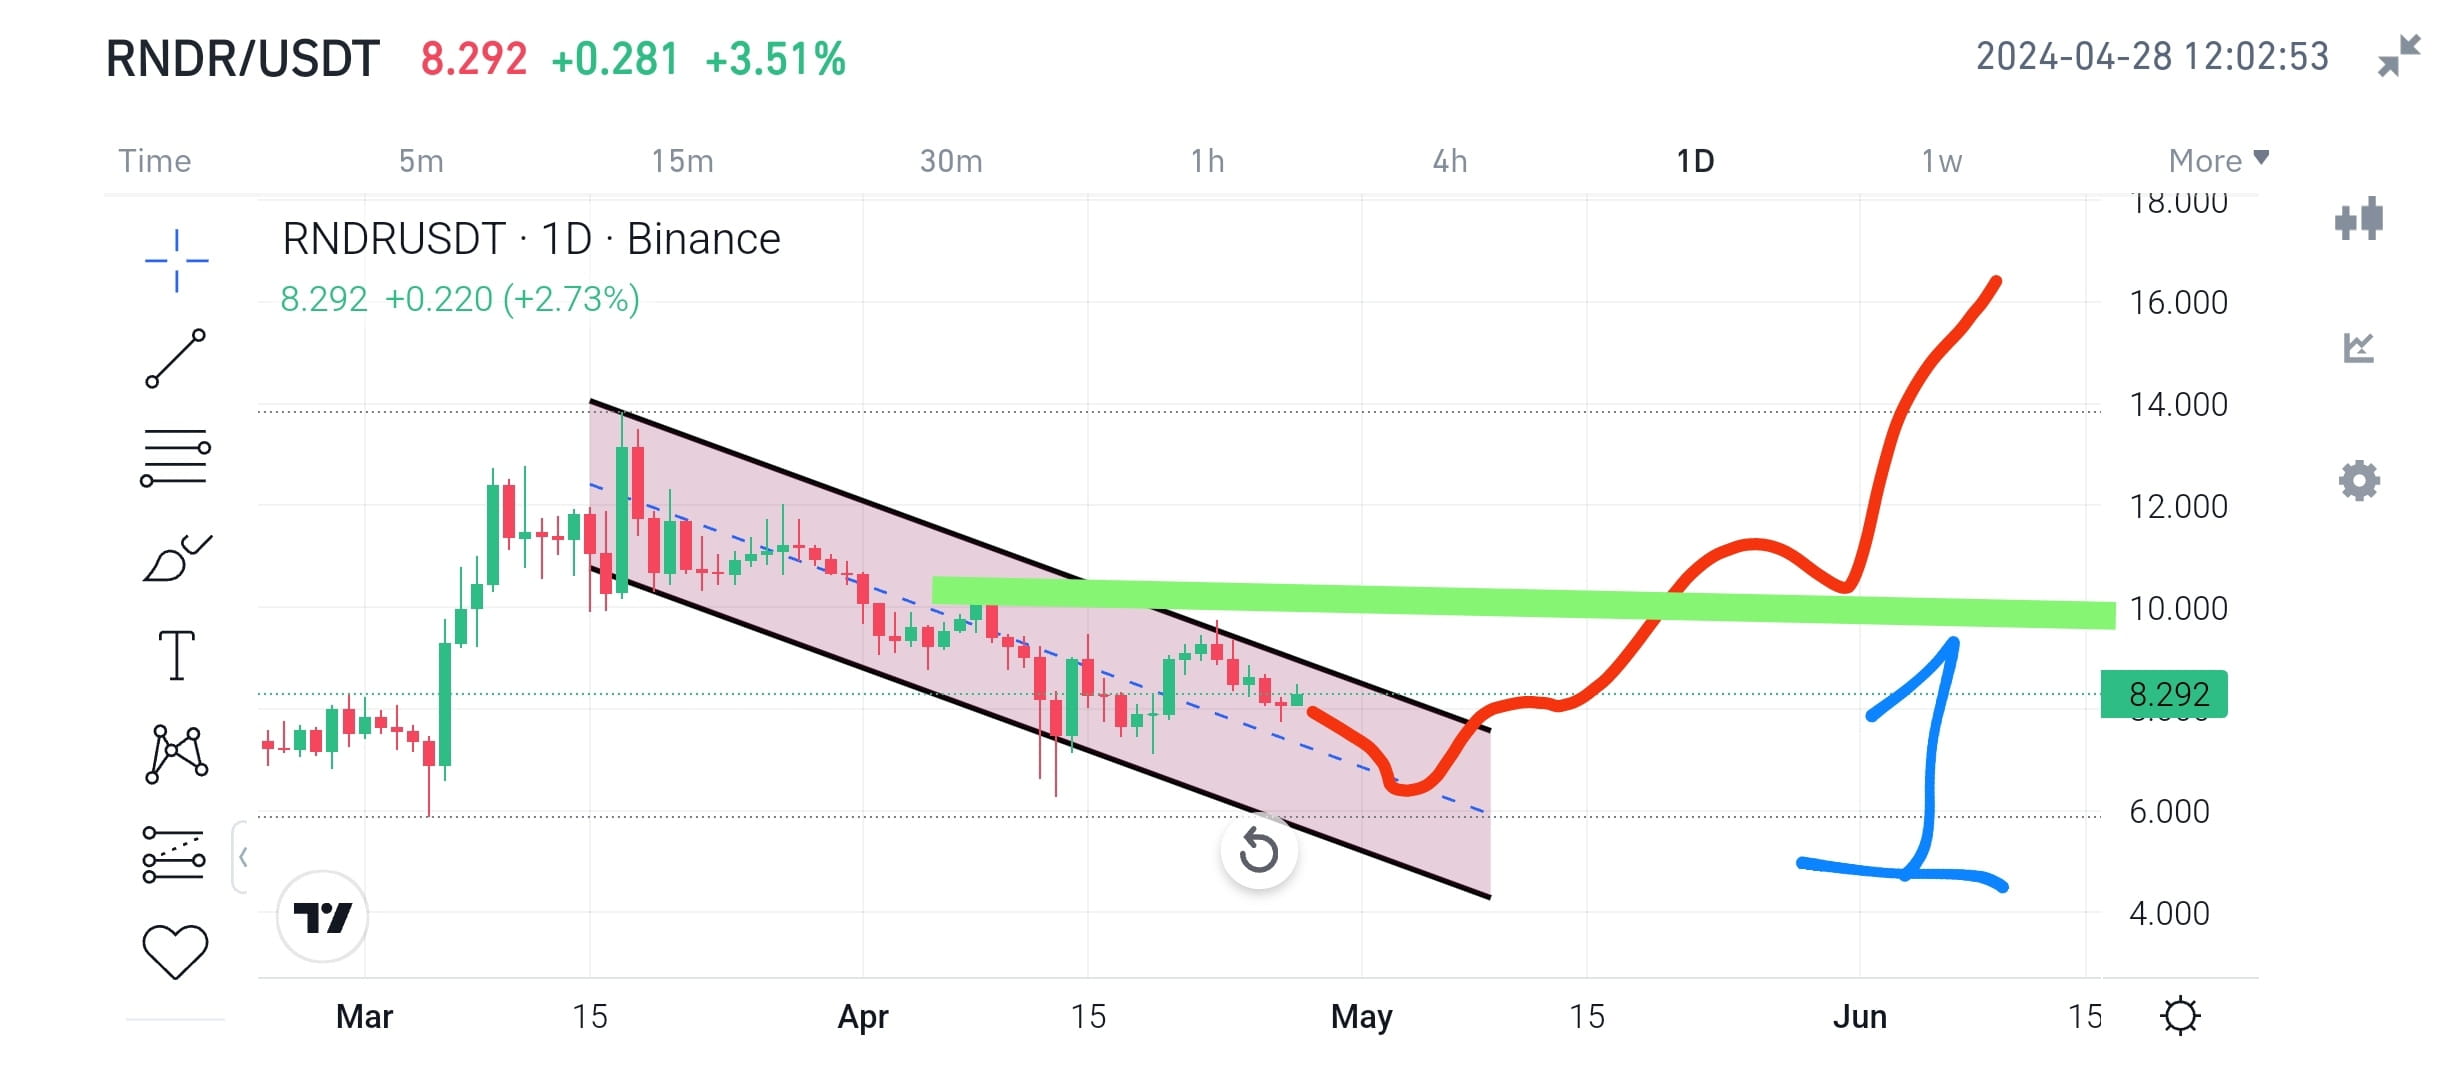
✅🔥 Figure-1 display that #RNDR/USDT💥 is consolidating between central and upper part of channel i-e., one acting as a support(central trendline) and other as a resistance(upper trendline) of descending channel. It may be possible that it retests the support zone a few more times from where it is highly likely prices may bounce and after which the price will possibly continue to move upward with a range of $15-16. RNDR is showing good movement and already up 50-70% from the recent dump.
✅🔥 Figure-2 chart displays that if Render fails to break resistance of descending channel then the price may dump hard and probably touch the bottom of the channel but and it is possible $RNDR will rebound from lower support of the channel. Bounce from support will be a strong like last move and it continue to move upward and possibly may break the upper resistance of the descending channel. This is a quite strong case for upward movement and future price direction
✅🔥 Spot buyers, if they bought at higher price then wait for $RNDR to come around the lower zone of the descending channel and then can do DCA and HODL for good reward. An observation from price performance, recent activities and market cap makes the case for possible will do 5-7x during the next leg of the bull market. Therefore stay calm and understand the recent situation of the market. AI coins are the leader of the bull run this season.
📝PLEASE PRESS FOLLOW if you like and agree with the idea and want more information about other crypto currencies. DYOR for financial activities. This information is only for learning and education purposes. Thank you.