桦忠分析
@HuaZhong_INVEST
来自桦忠分析团队第一手系统信号,微博:知行投资-华忠
Following
Followers
Liked
Shared
See original
A sure-win
大琪琪说币
--
Several types of people who are guaranteed to make money in the cryptocurrency market
There are three types of people -
1. Pumpers
2. Smart traders
2. Rule Breakers
As the name suggests, a rake is someone who does not participate in the gambling but only rakes money or acts as an intermediary:
- Exchange rebates. Don't discriminate against them. It's normal for big YouTubers and Weibo stackers to earn millions of RMB in commissions a month. Top YouTubers like MoonCarl earn tens of millions of USD in commissions a year. In addition, computer knowledge is also very useful in this field. There are some professional SEO technical teams that specialize in keywords in this area. Sometimes when you search for the name of an exchange on a search engine, the first search result you click on is their invitation link. It's normal for such top SEO teams to earn hundreds of millions of RMB a month in a bull market.
See original
The latest analysis of VTHO—beware of the peak signal!
$VTHO VTHO has dominated the limelight in the past two days, attracting a large amount of capital participation, and frequently appears on the hot product list. However, the warning signal just now reminded us that the continued amplification of trading volume resulted in the exchange of chips in a short period of time, which was accompanied by the concentrated distribution of short-term profit orders. This should be paid attention to. Let’s take a look at the 60-minute K-line chart. A callback signal has appeared. It would be unwise to pursue it at this time. In terms of short-term strategy, there are currently signals to close positions at profit, so you can consider taking a profit. The bottom 0.0055 is the bulls' defense line, so keep an eye on it. In short, you should be careful not to chase high prices at the moment, and you can take appropriate profits to close some positions. The real profit is what you make. Isn't it? Welcome to leave your opinion. #内容挖矿 $VTHO
See original
The latest analysis of $VTHO —beware of peaking signals!
VTHO has dominated the limelight in the past two days, attracted a large amount of capital participation, and frequently appeared on the list of hot products.
However, the warning signal just now reminded us that the continued amplification of trading volume resulted in the exchange of chips in a short period of time, which was accompanied by the concentrated distribution of short-term profit orders. This should be paid attention to.
Let’s take a look at the 60-minute K-line chart. A callback signal has appeared. It would be unwise to pursue it at this time.
In terms of short-term strategy, there are currently signals to close positions at profit, so you can consider taking a profit. The bottom 0.0055 is the bulls' defense line, so keep an eye on it.
In short, you should be careful not to chase high prices at the moment, and you can take appropriate profits to close some positions. The real profit is what you make. Isn't it? Welcome to leave your opinion.
#内容挖矿

See original
BONK latest trend analysis
$ As the largest MEME on the SOL chain, after the initial madness, it has carried out adjustments for more than a month. The exchange of chips is relatively concentrated, which can be understood as a relatively thorough washout. In the past two days, it has begun to exert strength. Dafu rebounded and entered the gainer list. So can it be pursued? From the K-line perspective, let’s analyze the appearance of the K-line dragon at the daily level. The only flaw is that the trading volume is still low. Although it seems that the trading volume is obviously increased at the sub-level 4-hour K, it should be noted that the trading volume that starts the market often has a negative impact on the market. How far it goes plays a crucial role, so the current trading volume is not enough to support the rising market going too far, and we remain cautiously optimistic. At present, 0.00001072 has become a strong support platform. Once it falls below here, the situation will not be good. Can we still chase higher now? I think the risk is on the high side, so those who haven’t boarded the car can try it with a light warehouse. #内容挖矿

See original
$BONK latest trend analysis
As the largest MEME on the SOL chain, after the initial madness, it has carried out adjustments for more than a month. The exchange of chips has been relatively concentrated, which can be understood as a relatively thorough washout. In the past two days, it has begun to exert strength. Dafu rebounded and entered the gainer list. So can it be pursued? Let’s analyze it from the perspective of K-line
The daily-level K-line has a rising dragon. The only flaw is that the trading volume is still low. Although it seems that the trading volume is obviously increased at the sub-level 4-hour K-line, it should be noted that the trading volume that starts the market often plays a decisive role in how far the market goes. It plays an important role, so the current trading volume is not enough to support the rising market going too far. We remain cautiously optimistic.
At present, 0.00001072 has become a strong support platform. Once it falls below here, the situation will not be good.
Can we still chase higher now? I think the risk is on the high side, so those who haven’t boarded the car can try it with a light warehouse.
#内容挖矿

See original
$ORDI latest trend analysis
As analyzed a few days ago, ORDI has broken through the downward channel and turned upward. This is good news for bulls. In the recent trend assessment, news no longer plays a big role. The internal structure and logic of the trend are the core. Bankers are also planning the Spring Festival market, and they will quickly pull the market as soon as the market environment improves. Let’s analyze the daily K-line chart. We can clearly see that after breaking through the 59.5 mentioned earlier, it quickly broke through 60 and continued to rise with inertia. We should pay attention to the pressure of 66.7 nearby. The chips here are relatively dense. A breakthrough means that a large number of stuck orders must be released. It depends on the financial strength. There are opportunities for both long and short-term contracts, but in the medium and long term, bulls still have the advantage. Continue to hold the spot price. Judging from the news and K-line charts, the rise is expected to continue. #内容挖矿 #TradeNTell

See original
$ORDI latest trend analysis
As analyzed a few days ago, ORDI has broken through the downward channel and turned upward. This is good news for bulls. In the recent trend assessment, news no longer plays a big role. The internal structure and logic of the trend are the core. Bankers are also planning the Spring Festival market, and they will quickly pull the market as soon as the market environment improves.
Let’s analyze the daily K-line chart. We can clearly see that after breaking through the 59.5 mentioned earlier, it quickly broke through 60 and continued to rise with inertia. We should pay attention to the pressure of 66.7 nearby. The chips here are relatively dense. A breakthrough means that a large number of stuck orders must be released. It depends on the financial strength.
There are opportunities for both long and short-term contracts, but in the medium and long term, bulls still have the advantage.
Continue to hold the spot price. Judging from the news and K-line charts, the rise is expected to continue.
#内容挖矿
#TradeNTell

See original
$SOL latest trend analysis
During the Spring Festival, SOL showed a steady rise, and the market has been rising for five consecutive years. It can be said that both in terms of popularity and financial strength, it outperforms other currencies. So as far as this momentum is concerned, coupled with healthy trading volume, the rise should continue. Analyzing the K-line chart, we can see that there is currently an obvious N-shaped rising structure, and the auxiliary indicator MACD has signs of water blooming above the zero axis. If it cooperates with a good market atmosphere, a bull market may appear. If you look closely, the pressure above is not very high, only around 122, but the impact of the matching amount should be able to break through smoothly. My system signals show: 1) The contract is currently dominated by long positions, short orders are avoided, or short orders can only be short-term with low leverage. There is an advantage in buying a long position, which can be 10 to 20 times. 2) Hold the spot boldly, there is no big problem. #内容挖矿 #TradeNTell

See original
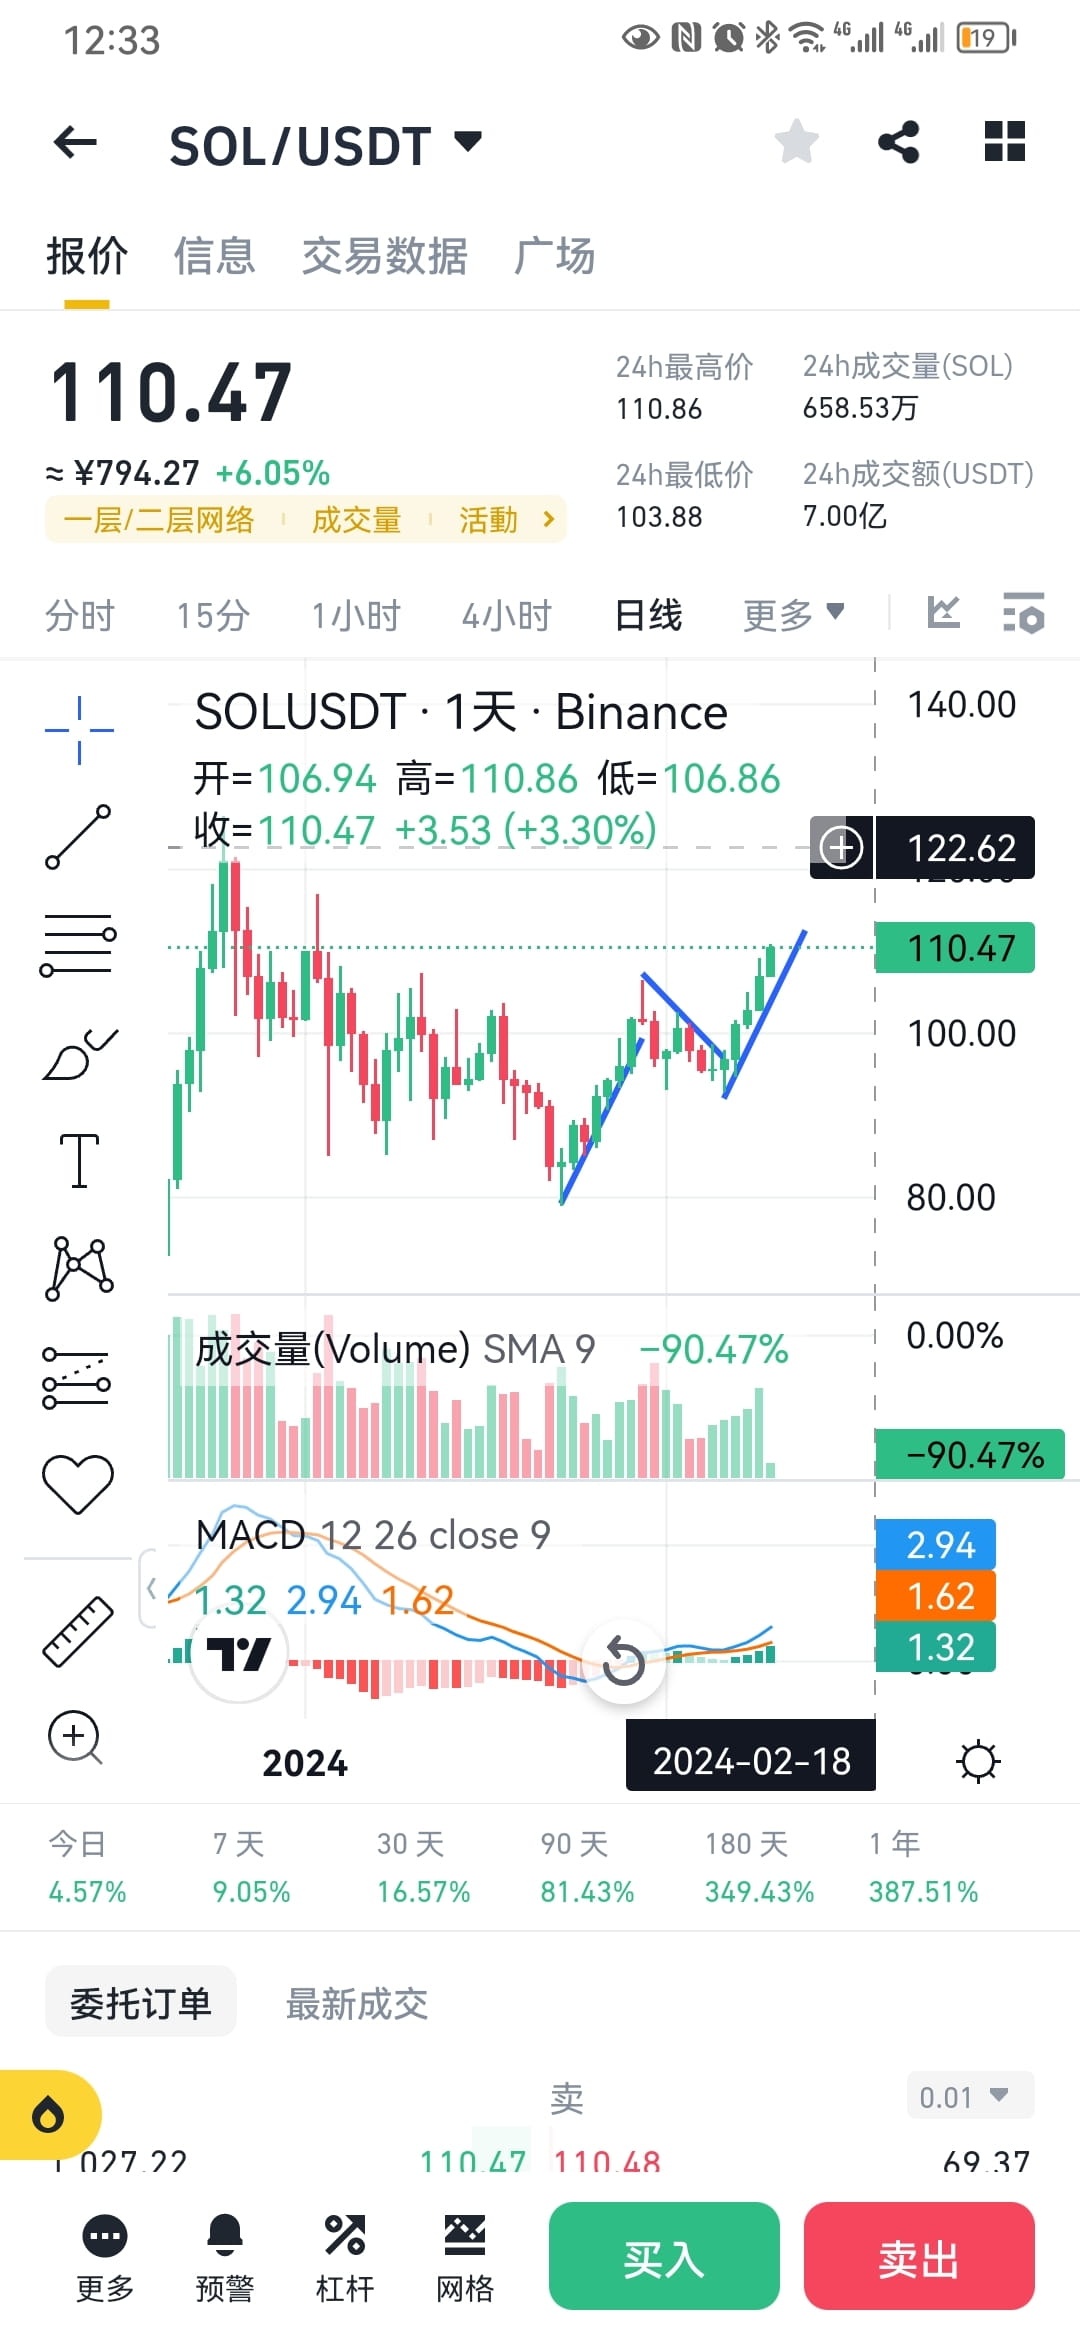
$SOL latest trend analysis
During the Spring Festival, SOL showed a steady rise, and the market has been rising for five consecutive years. It can be said that both in terms of popularity and financial strength, it outperforms other currencies. So as far as this momentum is concerned, coupled with healthy trading volume, the rise should continue.
Analyzing the K-line chart, we can see that there is currently an obvious N-shaped rising structure, and the auxiliary indicator MACD has signs of water blooming above the zero axis. If it cooperates with a good market atmosphere, a bull market may appear.
If you look closely, the pressure above is not very high, only around 122, but the impact of the matching amount should be able to break through smoothly.
My system signals show:
1) The contracts are currently mainly long positions, avoiding short orders, or short orders can only be short-term and low leverage. There is an advantage over long orders, which can be 10 to 20 times
2) Hold the spot boldly, there is no big problem
#内容挖矿
#TradeNTell
See original
ORDI latest trend analysis
The popularity of Audi has not diminished at all. In the past four days, it has followed Bitcoin into a rebound rhythm. The trend is relatively stable. Although it has not risen sharply, the visible confidence is still clearly reflected in the market price. Let's take a look at his daily K-line chart. After two months of adjustment, it has been relatively sufficient. At present, although it is still in the downward channel, a small support platform has been formed below, especially the rebound in recent days. This platform is generated, so it is still very promising to break through the downward trend line above in the next few days. Pay attention to the 59.95 pressure level to be broken. Once it is broken through, the short-term adjustment can be considered to be over. At the same time, the auxiliary indicator MACD has also appeared. Although the indicator is still below the zero axis, it clearly represents the end of the current decline. Generally speaking, the security of spot trading is relatively high at present. In terms of contracts, attention should be paid to controlling leverage. The recommended leverage range is between 5 and 10 times. $ORDI #内容挖矿 #TradeNTell

See original
$ORDI latest trend analysis
The popularity of Audi has not diminished at all. In the past four days, it has followed Bitcoin into a rebound rhythm. The trend is relatively stable. Although it has not risen sharply, the visible confidence is still clearly reflected in the market price.
Let's take a look at his daily K-line chart. After two months of adjustment, it has been relatively sufficient. At present, although it is still in the downward channel, a small support platform has been formed below, especially the rebound in recent days. This platform is generated, so it is still very promising to break through the downward trend line above in the next few days. Pay attention to the 59.95 pressure level to be broken. Once it is broken through, the short-term adjustment can be considered to be over.
At the same time, the auxiliary indicator MACD has also appeared. Although the indicator is still below the zero axis, it clearly represents the end of the current decline.
Generally speaking, the security of spot trading is relatively high at present. In terms of contracts, attention should be paid to controlling leverage. The recommended leverage range is between 5 and 10 times.
#内容挖矿
#TradeNTell

See original
DYM trend analysis
$DYM was newly launched on February 6th, and a cloud-penetrating arrow came out, so naturally thousands of troops came to meet it, and it became very popular. The underlying logic analysis shows that the airdrop dividend is huge. It has stayed at a high level since the launch of Binance, and the single-day increase has stabilized at more than 20 times. It is a green light in the current weak atmosphere. Judging from the K-line technical form, the number of samples is still very small at present. Looking at the one-hour K-line, we cannot say the exact pattern. At least we can see that the area around 4.68 is the defensive position of the bulls. Above this position, we can resolutely hold , spot risks are controllable. Once it falls below, technical advice turns to caution. Generally speaking, judging from the popularity, the enthusiasm for DYM is not over yet. Short-term investors can explore band opportunities from smaller periods, such as 15-minute K-lines. If you have anything to say about DYM, you are welcome to leave a message for discussion. #内容挖矿 #TradeNTell

See original
$DYM trend analysis
It was newly launched on February 6th, and a cloud-piercing arrow came out, so naturally thousands of troops came to meet it, and it became very popular.
The underlying logic analysis shows that the airdrop dividend is huge. It has stayed at a high level since the launch of Binance, and the single-day increase has stabilized at more than 20 times. It is a green light in the current weak atmosphere.
Judging from the K-line technical form, the number of samples is still very small at present. Looking at the one-hour K-line, we cannot say the exact pattern. At least we can see that the area around 4.68 is the defensive position of the bulls. Above this position, we can firmly hold , spot risks are controllable. Once it falls below, technical advice turns to caution.
Generally speaking, judging from the popularity, the enthusiasm for DYM is not over yet. Short-term investors can explore band opportunities from smaller periods, such as 15-minute K-lines. If you have anything to say about DYM, you are welcome to leave a message for discussion.
#内容挖矿 #TradeNTell

See original
$AI trend analysis on January 31
For more currency analysis, please leave a message to AI. This currency has been very popular recently. Since its listing, after a sharp rise on the first day, there has been a wide range of fluctuations. The fluctuation rhythm has obvious regularity. To do this, you need to start from the daily cycle. Grasp the time dimension. In order to better analyze the microstructure, today we will take a look at its internal operating rules from a relatively microscopic perspective of the 60-minute cycle, and why it still maintains an upward shock pattern after the recent decline. In the one-hour chart, a long negative line appeared this afternoon and fell to the previous bottom, which is the neck support position. It should be said that life is hanging by a thread, but after all, it remains above the upward trend line of the arrow. On the spot side, we believe that it is still worth holding. Let’s test the support. If it can hold up, there is still room for support at 1.25, which is very critical. Please leave a message for more currency analysis. #内容挖矿 #TradeNTell

See original
$AI trend analysis on January 31
AI, this currency has been very popular recently. Since its listing, after the first day's sharp rise, there has been a wide range of fluctuations, and the rhythm of fluctuations has obvious regularity. To do this, we need to grasp the time dimension of the daily cycle.
In order to better analyze the microstructure, today we will take a look at its internal operating rules from a relatively microscopic perspective of the 60-minute cycle, and why it still maintains an upward shock pattern after the recent decline.
In the one-hour chart, a long negative line appeared this afternoon and fell to the previous bottom, which is the neck support position. It should be said that life is hanging by a thread, but after all, it remains above the upward trend line of the arrow.
On the spot side, I think it is still worth holding. Let’s test the support. If it can hold up, there will be room for it later.
Support level 1.25, very critical
$AI
#内容挖矿 #TradeNTell

See original
$MANTA trend analysis on January 31
1. MANTA has increased a lot since its launch. Although there is strong support from the large platform, the short-term high price has overdrawn the higher valuation. If you want to continue to rise, you need greater capital inflow. From a fundamental point of view, with the As the early hype subsides, it may now be in a periodic top area. 2. Let’s look at his 60-minute K-line again. We can clearly see that it is currently in a high level for a long time and has revealed a downward pattern. The long negative line pointed by the arrow is a dangerous signal. To Attention has been drawn to the fact that there is a support level below near 3.29. Once this support is effectively broken, the decline may accelerate and spread. 3. There may still be time to consider stop loss for spot prices, but contracts need to fully consider the risks brought by leverage and the rapid decline of short positions, or even insertion of pins. 4. Generally speaking, it is no longer necessary to chase high prices, and you need to be especially cautious with long contracts. #内容挖矿 #TradeNTell

See original
$MANTA trend analysis on January 31st
1. MANTA has increased a lot since its launch. Although there is strong support from the large platform, the short-term high price has overdrawn the higher valuation. If you want to continue to rise, you need greater capital inflow. From a fundamental point of view, with the As the early hype subsides, it may now be in a periodic top area.
2. Let’s look at his 60-minute K-line again. We can clearly see that it is currently in a high level for a long time and has revealed a downward pattern. The long negative line pointed by the arrow is a dangerous signal. To Attention has been drawn to the fact that there is a support level below near 3.29. Once this support is effectively broken, the decline may accelerate and spread.
3. There may still be time to consider stop loss for spot prices, but contracts need to fully consider the risks brought by leverage and the rapid decline of short positions, or even insertion of pins.
4. Generally speaking, it is no longer necessary to chase high prices, and you need to be especially cautious with long contracts.
#内容挖矿 #TradeNTell

See original
$SOL trend analysis on January 30
The new project is quite magical and has brought such a huge market. As for whether the project has revealed signs of a Ponzi scheme, it still needs to be verified. I believe every friend has a yardstick in his mind. The driving force of the news, combined with the K-line technical side, formed a resonance driving force for the rise. K-line technical perspective: As shown in the figure below, the 1-hour K-line is currently in a stable rising channel and has been building a platform. After stabilization, the band will rise. This result is relatively strong. On the spot side: Just hold on until the support is broken and you won’t get off the market. On the contract side: Considering the increase in volatility, control the leverage between 3 and 6 times, and be wary of the risk of pin insertion. Support level 98, stop loss level for long orders: Where is the pressure above 95.2? It hasn't been found yet. Don't talk about rising prices, and be more cautious when selling short. $SOL #sol#内容挖矿 #TradeNTell

See original
$SOL trend analysis on January 30
The new project is quite magical and has brought such a huge market. As for whether the project has revealed signs of a Ponzi scheme, it still needs to be verified. I believe every friend has a yardstick in his mind. The driving force of the news, combined with the K-line technical side, formed a resonance driving force for the rise.
K-line technical perspective: As shown in the figure below, the 1-hour K-line is currently in a stable rising channel and has been building a platform. After stabilization, the band will rise. This result is relatively strong. In terms of spot goods: Just hold it and it won’t get off until the support is broken.
Contract aspect: Considering the increase in volatility, control the leverage between 3 and 6 times, and be wary of the risk of pin insertion.
Support level 98, stop loss level for long orders: 95.2
Where is the pressure above? It hasn't been found yet. Don't talk about rising prices, and be more cautious when selling short.
$SOL #sol
#内容挖矿 #TradeNTell

See original
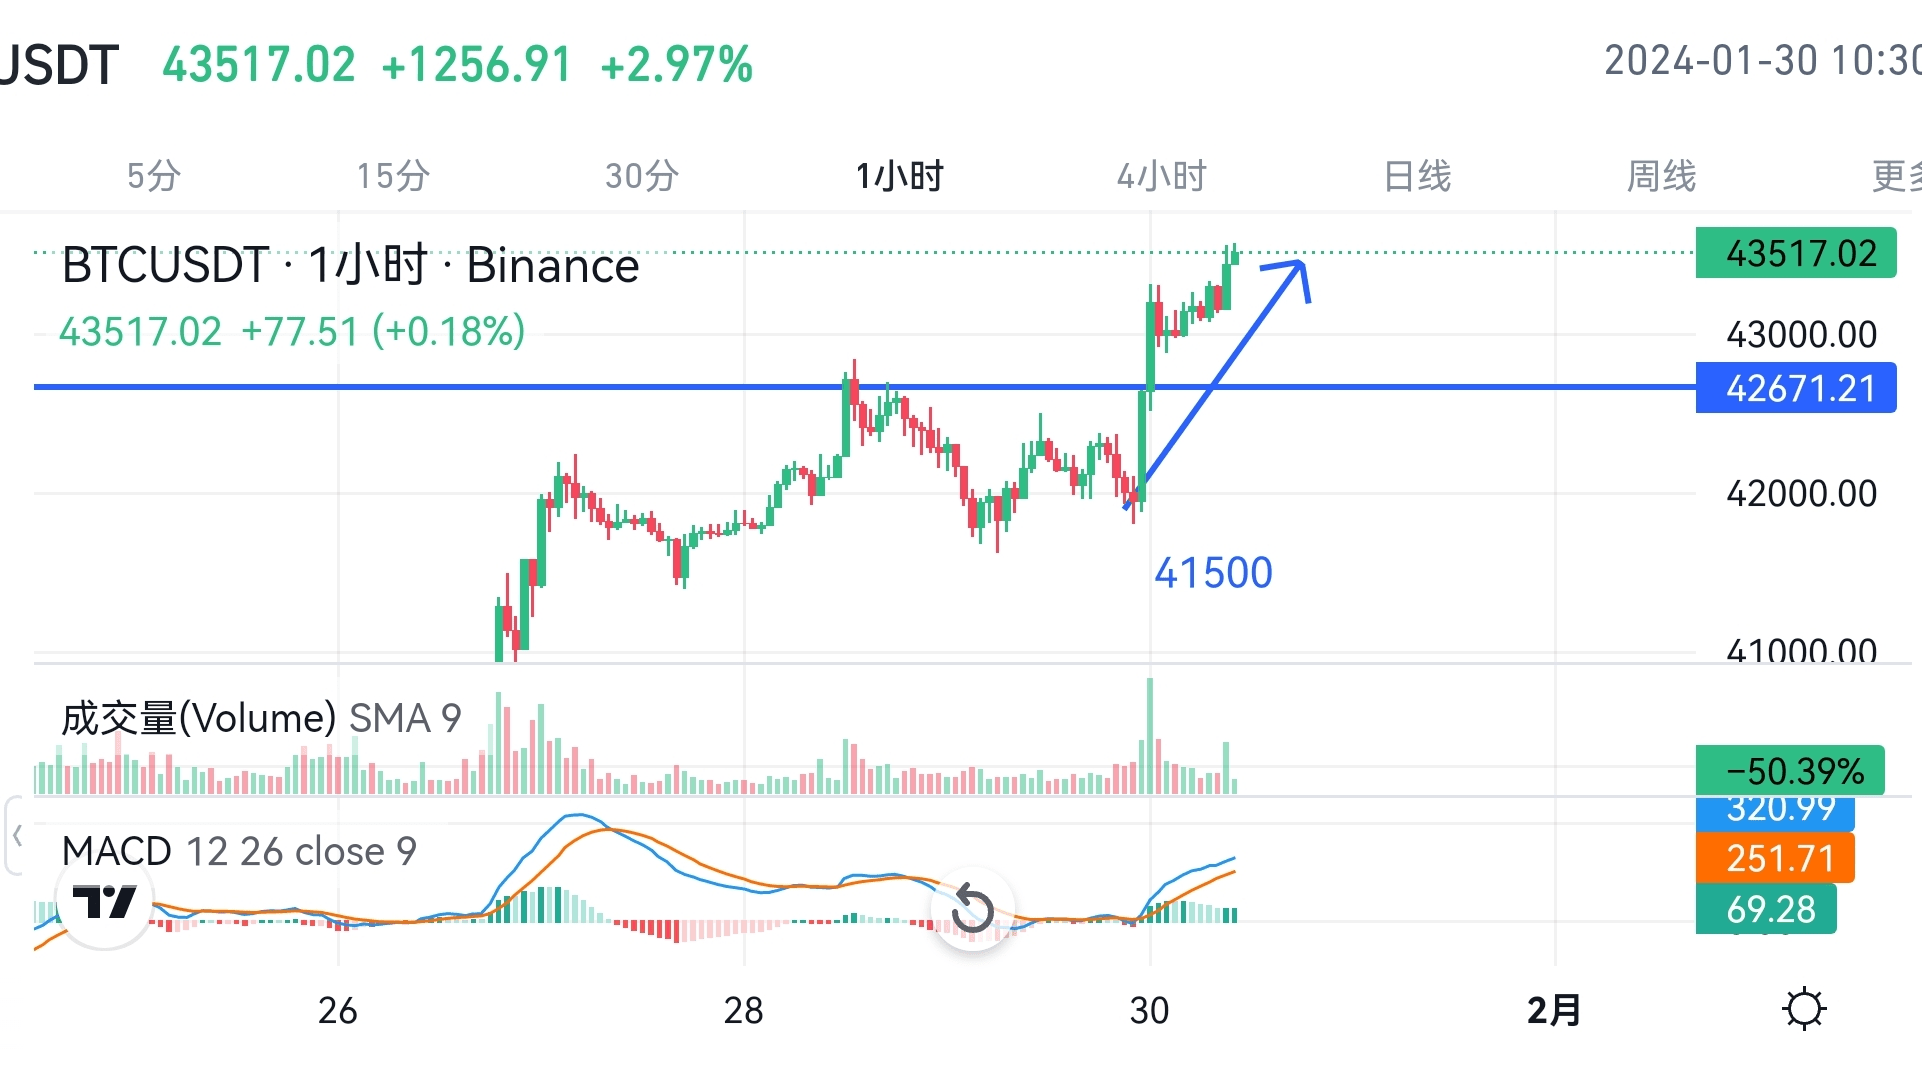
$BTC Trend Analysis on January 30
According to previous analysis and judgment, Bitcoin has entered a volatile upward channel, and today's actual trend has been further verified. The current news is relatively stable. Although there is a lack of new driving forces, market confidence and enthusiasm have not receded after such a long period of consolidation, so the fundamentals are supportive. From the K-line technology, it can be clearly seen that 41500 provides strong support. After two consecutive strong K-line breakthroughs as shown in the figure below, it began to fluctuate and rise. From the spot perspective, you can still hold contracts boldly and worry-free. The volatility has dropped. Aggressive short-term investors can appropriately increase the leverage for spread trading. It can be controlled below 20 times. The probability of going long is higher based on 42700 as support. The first pressure above is generally maintained around 44500, with a bullish approach. #内容挖矿 #TradeNTell #BTC $BTC