It may take months or even years to learn something. In trading, I think the most time-consuming thing in the early stage is to find the characteristics of your own trading time frame and chart pattern.
With these two things clearly identified, it will be much easier to choose a trading strategy that suits you, which will bring more possibilities for success in your trading. Fortunately, there are only three main chart patterns at present, so it is not too complicated for everyone to identify the chart pattern that suits them.
If you are already experienced and can easily master all three of the following chart patterns, that would be great. However, for those who are still in the early stages of trading, it would be helpful to choose one of them and study it in depth.
The reason for this advice is that the human brain works best when it is working deeply in a single model, which allows you to maintain a high level of focus.
Traders should not follow the crowd. Don't switch to a new chart pattern just because someone tells you which pattern is useful. We all need to find our own style, which is the most beneficial way for ourselves.
Let’s look at the three main types of chart patterns.
Trend Chart Mode
This is the most common chart pattern, and you’ve no doubt heard the phrase: “The trend is your friend.”
Many traders are good at trend trading. Like any other pattern, there are different ways to trade trend chart patterns. Some trading systems use moving averages, while others focus on price action analysis.
It doesn’t really matter what system you use. What really matters is whether you are good at following the trend and whether you can successfully use the trend to exit with profit.
For example, in the chart below, can you easily buy at the point indicated by the arrow?
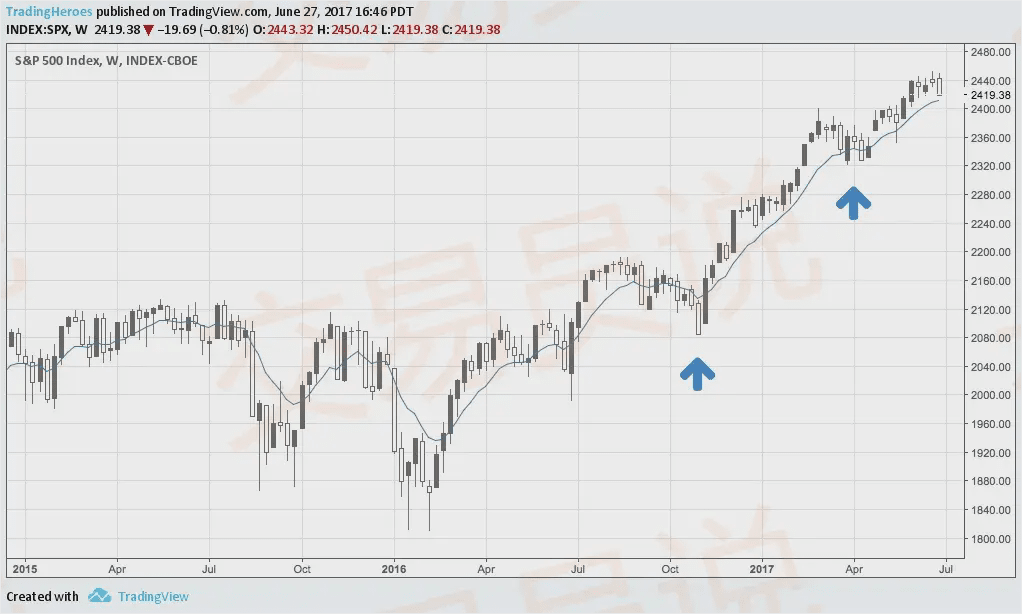
Or would you be so intimidated when you're in it that you wouldn't dare to do anything?
Another way to trade is to buy when a new high is reached. For example, in the picture below, if you are asked to buy at any orange line, can you do it easily?
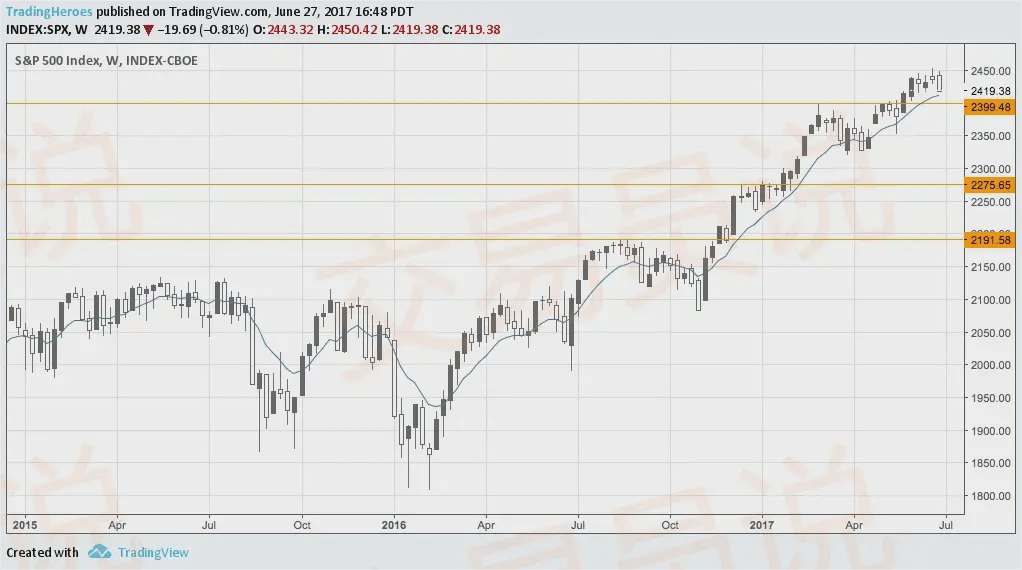
If either of these two entry methods appeal to you, then you may be suited to being a trend trader. Trend chart patterns are suitable for traders who want quick results and like to buy or sell in the trend.
Counter-Trend Chart Patterns
Some traders are good at finding reversal points in the market. If you often go against the grain in your daily life, then you may want to try trading against the trend more often.
There are many ways to trade against the trend, one of which is to trade in the opposite direction at the resistance or support level. For example, the following figure:
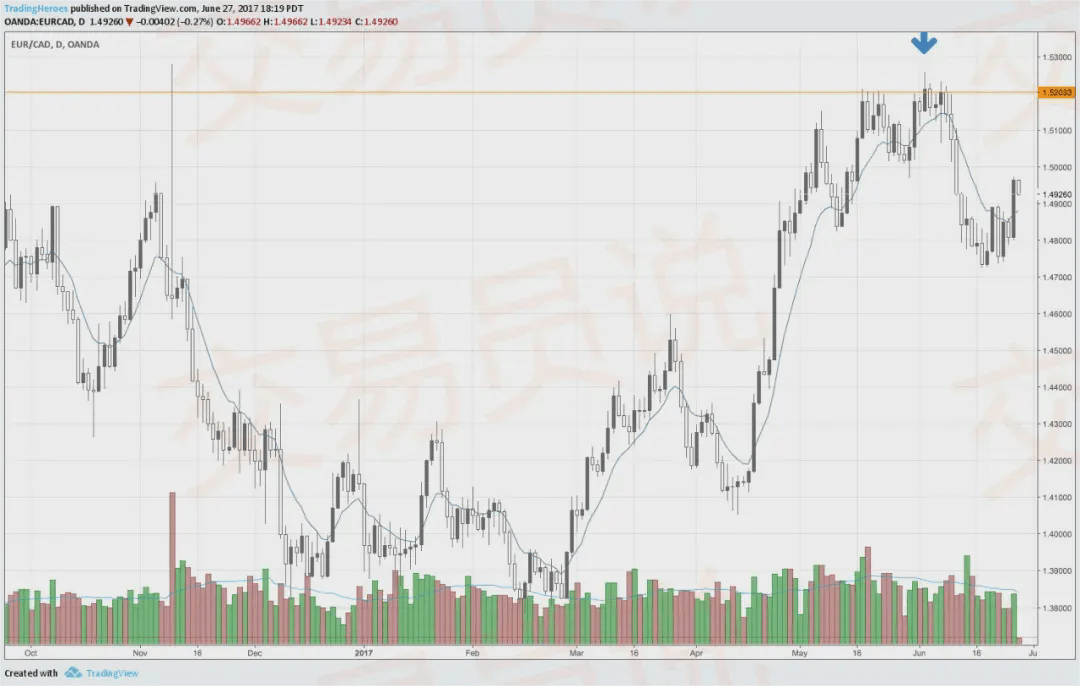
As the price approaches the orange line, would you choose to short?
Looking at this picture, your answer is of course yes. But think about it, in real trading, you can't see what happens after the price touches the orange line, you only know that the price seems to keep rising, at this time, are you still willing to short?
If you have tested your strategy many times and believe that the probability of price reversal is high, then you should be able to believe that your prediction will come true. With such a personality, you may be suitable for counter-trend trading.
Breakout Chart Patterns
The last type is the breakout chart pattern. I am not very good at breakout trading myself, so I try to avoid this type of pattern. However, it can still be useful for some traders.
The chart below is a pure breakout. When I say “pure” I mean that some traders may also look for breakouts, but they use breakouts as entry signals for trades, which in my opinion is still considered trend trading.
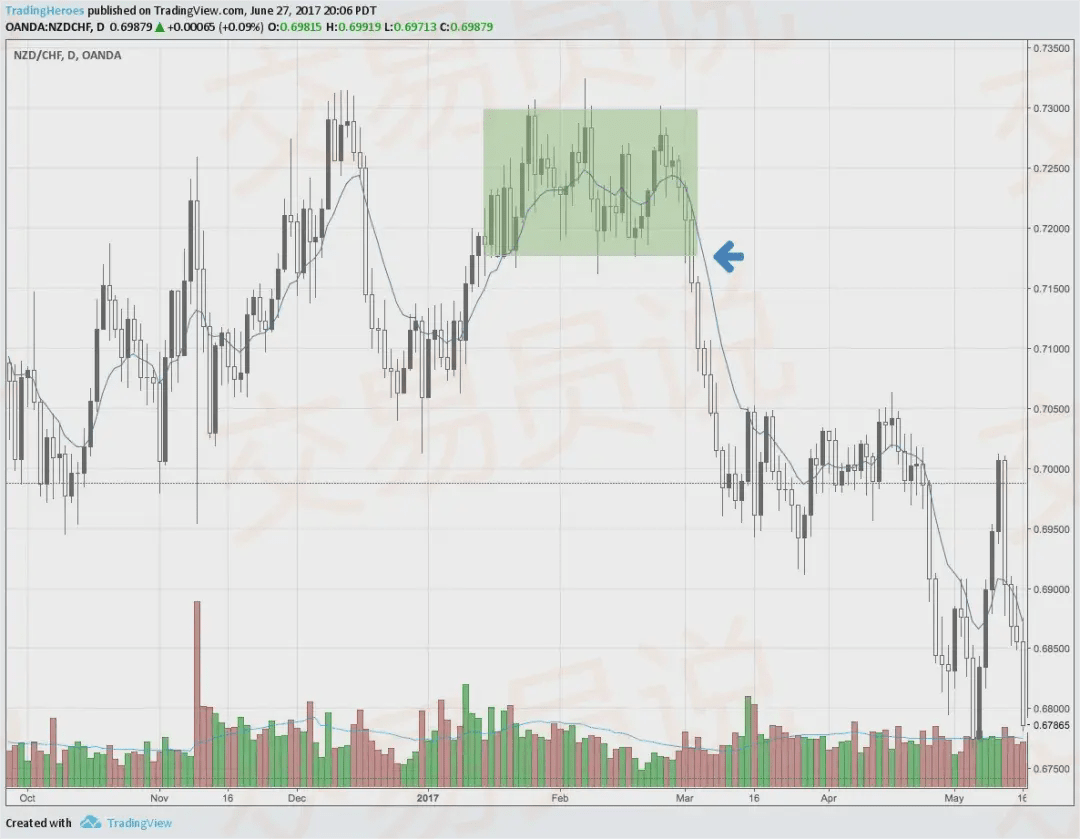
As you may have experienced, the biggest problem with breakout trading is that there are a lot of false breakouts in the market…like this:
A breakout is a very unique chart pattern because it does not take into account past price action. All a trader has to do is look for a consolidation range and then position for a breakout.
How to find out which chart pattern is best for you?
After understanding the above three chart patterns, the next question is, how to determine which chart pattern is suitable for you? There is no other way, you can only do more homework.
First, choose a trading method for each chart pattern. Don't worry about whether the trading method works for now. The biggest purpose of doing this step is to find out which chart pattern you feel most comfortable using. If you want to simplify this step, just trade price action.
After determining which chart pattern you prefer, the second step is to find a trading method that is suitable for this pattern. What is more important in this step is that you need to combine different elements of some similar trading systems and gradually establish your own unique trading method.
To be honest, it is not easy to find a chart pattern that suits you. However, sharpening the knife does not delay the chopping of wood, and the time investment in the early stage will save a lot of waste in the future.
Of course, you may feel that you are suitable for several trading methods and modes, which is normal. But I still recommend that you use one of them as the key method. With a "backbone", you will not always hesitate between different trading methods.