盈贝趋势量化-Vicky左
@vickyzuo888
Following
Followers
Liked
Shared
See original
[Yingbei Trend Quantitative BNB Analysis Strategy on July 10]
[News Analysis]
Binance will celebrate its anniversary on July 14, and anniversary-related activities may bring benefits to BNB;
CZ is expected to return in August or September, and this news may further boost market confidence;
According to the previous rhythm, Binance will basically have 1-2 new projects every month, and the first new project in July is expected to be launched in mid-month.
[K-line trend pattern analysis]
The recent price fluctuations have been large, and there have been many K-lines with long upper and lower shadows, indicating that market sentiment is unstable.
On July 6 and 7, 2024, there were large positive and negative lines, respectively, and the daily line fluctuated widely.
1. Technical indicators:
MACD: Both DIF and DEA are below the zero axis, and the macd histogram is negative. The current daily and weekly lines are in a bear market, but the daily bear market has weakened signs.
BOLL: The Bollinger indicator 4-hour closing K-line runs between the middle track and the upper track. The daily K-line breaks the lower track and returns to the upper track. The retracement to the lower track of the daily line will form support.
MA: MA7 (511.08) is lower than MA30 (569.65) and higher than MA180 (509.61). The medium-term trend is short-term, and the rebound daily and weekly lines will form effective suppression.
2. Trading volume:
On July 5, 2024, the trading volume reached 992708, the highest in recent times. The trading volume gradually decreased in the following days, indicating a decline in market activity. The trading volume has been relatively stable in recent days, with no obvious increase or decrease in volume.
【Buy and sell points】
Buy point 1: 497 (3-day Bollinger lower rail support) break and wait for the next position;
Buy point 2: 490.1 (4-hour Bollinger lower rail support);
Buy point 3: 482.7 (4-hour SAR support and 8-hour Bollinger lower rail);
Buy point 4: 471 (12-hour Bollinger lower rail support).
Buy stop loss point 469, weekly Bollinger lower rail support point.
Sell point 1: 530-533 (recent highs), sell point 2 549-550 (daily SAR pressure and EMA120-day pressure)
Short stop loss point 555-558 (slightly higher than the previous high of 556.7 to prevent false breakthroughs) #BNB金鏟子 #币安7周年 $BNB

See original
[Yingbei Trend Quantitative July 5 Bottom-picking Strategy]
On July 3, BTC broke through the 62,000 support and went down very smoothly, hitting the lowest point near 53,485, a drop of nearly 15%. Basically all long positions with 10x leverage were liquidated, and nearly 600 million US dollars of long positions were liquidated at 54,000 points.
Ethereum's lowest point was 2810, a drop of about 18%. The whales were liquidated about 173,230 ETH at around 2850, worth 10.7 million US dollars. Sun Yuchen may lose 66 million US dollars due to the 10% plunge of Ethereum today. From February to June, he bought a total of 361,000 pieces, with an estimated cost of 1.1 billion US dollars.
USDT premium is serious, reaching as high as 7.5. At around 3:36 pm, 250 million new USDC were minted on the Sol chain.
Zhu su, founder of Sanjian Capital, re-purchased Ethereum at a price of 2,900 US dollars. Shenyu tweeted that BTC has returned to the shutdown price range again, and the opportunity has come again.
After the whale liquidation, a stage bottom was formed. The 4-hour double needle bottoming out finally began to stabilize. In the afternoon, a reminder was given to spot to buy the bottom.
The ETH bottoming price is in the range of 2820-2850, and the BTC bottoming range is around 54,000. The BNB bottoming price is around 455.
Tonight's US non-agricultural data will determine the start time of future interest rate cuts, and also determine whether the market can accelerate the rebound or fall again to challenge the 50,000 mark. On July 15, the US Ethereum spot ETF, and the Federal Reserve interest rate decision in the middle of the month.
At present, the probability of a rate cut in September is expected to reach 60%. At present, the bottom shock is needed to determine the bottom, and the rebound test is needed. When Bitcoin stabilizes at 60,000 points again, the daily line will usher in a round of rebound!
Fixed investment strategy:
ETH 2835-2725-2455 three positions in batches
BNB 456-425-400 three positions in batches
Bottom-hunting is to enter the market in batches at the relative bottom, and escaping the top is to sell in batches at the relative high point range! #BTC☀ #ETH🔥#BNB走势 $BNB


See original
Analysis of the hot project io.net
Project introduction: io.net is a decentralized computing network that supports the development, execution, and expansion of ML applications on the Solana blockchain, combining 1 million GPUs to form the world's largest GPU cluster and DePIN.
io.net solves this problem by aggregating GPUs from underutilized resources such as independent data centers, crypto miners, and crypto projects like Filecoin and Render, which are combined in the Decentralized Physical Infrastructure Network (DePIN) to give engineers access to massive amounts of computing power in a system that is accessible, customizable, cost-effective, and easy to implement.
io.net solves this problem by aggregating GPUs from underutilized resources such as independent data centers, crypto miners, and crypto projects like Filecoin and Render, which are combined in the Decentralized Physical Infrastructure Network (DePIN) to give engineers access to massive amounts of computing power in a system that is accessible, customizable, cost-effective, and easy to implement.
See original
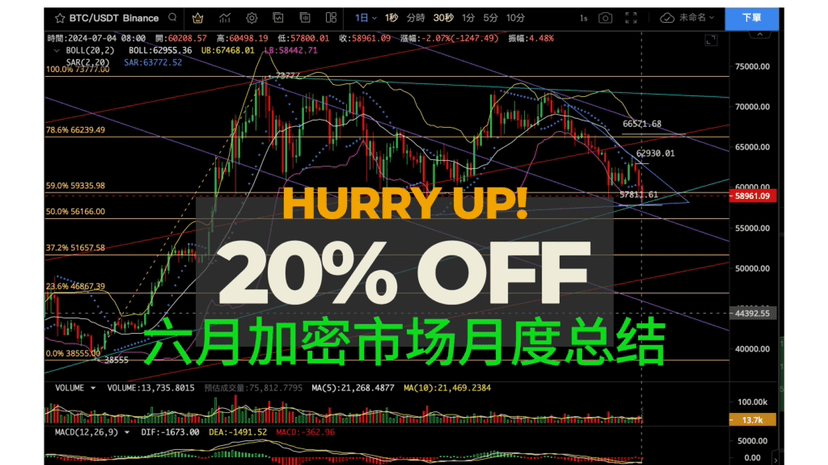
June Crypto Market Summary
In June, the total adjusted on-chain transaction volume of Bitcoin and Ethereum fell by 13.4% to $338 billion, with the adjusted on-chain transaction volume of Bitcoin and Ethereum both falling by 13.4%.
The adjusted on-chain transaction volume of stablecoins in June fell by 4.5% to US$839.6 billion; the issued stablecoin supply increased, but the increase was only 0.4% to US$142.6 billion, of which the market share of the US dollar stablecoin USDT increased to 79.1%, while the market share of USDC fell slightly to 17%.
Bitcoin miner revenue fell by a smaller 0.1% in June to $961.9 million, while Ethereum staking revenue rose by 8.1% to $289.2 million.
See original
[Yingbei Trend Quantitative July 3rd Evening Review and Analysis]
Today, the transaction volume of 6 Hong Kong virtual asset ETFs was HK$18.2 million;
A giant whale deposited 1,723 BTC worth US$106 million to Binance within 24 hours;
In the past 24 hours, BTC fell by 3.8%, the global crypto market value was $2.28 trillion, a drop of 3.76% (88.778 billion), 24H full network liquidation of 149 million, long orders liquidation of $128 million accounted for 86.13%, BTC liquidation price concentrated at $60398-$62048.
BTC opened at 62135.46 in the afternoon and broke 60000 and fell to 59600 before rebounding. The current price is 60400. If it stabilizes at 60000, there is a chance to rebound to 62000; if it breaks 59500, it will look down to 58600 and trend support around 57500. Reached the first target range of 60000-59500 for retracement and position building. #BTC☀
ETH opened at 3421, high 3432 low 3281.6, down 3.62%, current price 3296; broke 3280 and looked down at 3200 and trend support 3160. Today, Ethereum also reached the previously given retracement and position building range of 3300, the second position building range of about 3220, and the third position building range of about 3160. #ETH🔥🔥🔥🔥
Ethereum spot ETF was postponed, the Fed's interest rate cut expectations were delayed, and the market lacked bullish momentum in the short term. Next, we need to focus on the US non-agricultural data at 20:30 this Friday night. If the market does not break a new low before the data, BTC is expected to rebound and break through 64000 to explore the 65000-66000 range. #以太坊ETF批准预期 #非农就业数据即将公布 $BTC $ETH $BTC

See original
[Yingbei Trend Quantitative Analysis of Bitcoin Trend on June 27]
1. K-line pattern:
- The K-line has shown obvious high fluctuations recently, and the price has been blocked near 70,000 many times.
- There have been large negative lines in recent weeks, especially the two weeks of June 17, 2024 and June 24, 2024, indicating that the market is under heavy selling pressure.
2. Technical indicators:
- MACD: Both DIF and DEA are in negative areas, and the MACD histogram continues to be negative, indicating that the current market is in a bearish trend.
- RSI: The RSI has retreated from the overbought zone and is currently hovering around 50, showing that the market momentum is weakening, but it has not yet entered the oversold zone.
- EMA: The short-term EMA7 (64740.52) has fallen below the medium-term EMA30 (57636.43) and is far away from the long-term EMA120 (40468.56), further confirming the bearish trend.
3. Trading volume:
- The trading volume increased significantly from May 20, 2024 to June 10, 2024, and then decreased, indicating that a large amount of funds entered the market during the early rise, while the trading volume shrank during the recent adjustment stage, showing a wait-and-see sentiment. Increase.
- The trading volume on June 24, 2024 was 112,969, which was a decrease compared to previous weeks, indicating that market participation was reduced.
[Trend Determination] BTC fluctuates at the bottom in the short term. After hitting the bottom and stabilizing, there is a stage of rebound. The rising trend line support point in October 23 is 57500, and the previous low and Fibonacci golden section 50% support is 56166.
[Analysis of pressure support level]
Buying point one: 58600 USDT (reason: small-level trend line support, the previous low near 58400 can be used as a stop loss point)
Buying point two: 57550 USDT (reason: the support point of the rising trend line, close to the integer point 57000 can be used as a stop loss point)
Buying point three: 56,200 USDT (reason: 50% support of the golden section, and close to the integer support of 56,000 points)
- Long stop loss point: 55,000 USDT (reason: 1,000 points below buying point 2 to prevent continued sharp decline after falling below)
Rebound target one: 62600 points, 4-hour Bollinger upper rail pressure
Rebound target two: 64200 points, the upper edge pressure level of the wedge triangle
Rebound target three: 65,000 points, daily Bollinger mid-track pressure
The strong pressure zone is 66200-67000 points. This range is also a fierce competition between the long and short parties. #币安合约锦标赛 #BTC☀ #趋势分析 $BTC


See original
[Yingbei Trend Quantification June 26 People Trend Analysis]
Previous situation review: The partners who followed the strategy to buy the bottom the day before yesterday entered the market near 0.078 and currently have a profit of 24%. Recently, people have made almost 50% in several waves. The rhythm is very good. Keep it up. Our goal is to eat meat together.
[Price trend analysis]
1. K-line pattern:
- The recent K-line shows a large fluctuation. On June 9, it rushed up to 0.144 and then closed the upper lead. On June 10, the upper lead was long and the closing price was lower than the opening price. The selling volume was obvious and the market turned from rising to callback. After 15 days of callback, the overall decline from the highest point of 0.144 to the lowest point of 0.076 was 47%. On June 24, the closing price of the long lower lead was higher than the opening price, and the funds entering the market increased. The bottom was established and entered a rebound.
2. Technical indicators:
- MACD: On June 20, the 4-hour MACD formed a golden cross, but the daily MACD short volume was strong. On June 24, the daily MACD short volume was significantly reduced, and the 4-hour long volume increased.
- Boll: The 4-hour Bollinger lower rail 0.076 has obvious support, and the Bollinger opens upward after crossing the middle rail.
[Trend judgment] People is bullish in the short term, pay attention to the intraday support of 0.09, the intraday pressure of 0.1, and the next target for upward breakthrough is 0.105-0.11, and the downward break is 0.085-0.08.
[Pressure support level analysis]
- First support level: around 0.093 (reason: 0.076 rebound trend line lower edge)
- First entry level 0.09-0.0885 area
- Second entry level 0.085-0.083 interval
- Third entry level 0.08-0.078 interval
Key support 0.076, break the position to see 0.073 (weekly middle track support)
- Upper target: 0.1-0.11-0.135-0.145-0.155, note that 0.155 is the trend channel pressure level and there will be a retracement.
- Second target area: Stand firm at 0.1 to enter the next upward trend, see 0.135-0.15, long-term see 0.18-0.2#Meme板块普涨 #people #PEOPLEUSDT $PEOPLE


See original
According to TokenUnlocks data, tokens worth about $104.23 million were unlocked from June 24 to 30. Among them: OP unlocked 2.88%, worth $57.36 million;
ALT unlocked 6.92%, worth $21.27 million;
YGG unlocked 4.48%, worth $11.15 million;
PRIME unlocked 1.83%, worth $7.99 million;
AGIX unlocked 0.67%, worth $5.81 million;
ACA unlocked 0.46%, worth $340,000;
TORN unlocked 2.41%, worth $290,000.
This week cliff unlocks $104,234,362.88+
Follow Yingbei trend quantification, and be one step ahead in bottom-fishing/top-escape.
See original
The essence of trading: follow the trend, stop loss, and take profit. There are a total of 6 words that look simple, but many people cannot correctly understand them throughout their lives. First of all, follow the trend and a group of people will be stuck. The two words "follow the trend" include trend judgment. Only by judging the large-scale trend can you find the trend at the small level. If you can't judge the trend and don't know how to follow the trend, I advise you to exit the market early, because you will only make small profits and lose big losses. Then let's talk about stop loss. Stop loss is a safety margin. Buffett said the first principle of investment: never lose money. The second rule is to never forget the first rule. It can be seen that protecting the principal is the primary task of investment, because once the principal suffers a loss, it needs a greater return to make up for this loss. So don't blindly pursue high returns and ignore risks. Stop loss is a safety belt to control risks. Find the key position of trend change in the trend, and stop loss in time to protect the principal when the trend reverses. Stop profit. Many people think that it is very simple to make money and run, but there is a saying that those who know how to buy are apprentices, and those who know how to sell are masters. If you don't do stop profit well, you can only make small money forever. You must have a set goal and know how to keep profits, and effectively reduce risks in the trend to gain greater returns. What stage are you in now? #趋势分析 #交易理论 $USDC
$BTC $ETH
$BTC $ETH

See original
#MegadropLista points are out, with a total of about 2.75 billion points, which is much more than the previous period. The income will be relatively less. If an account does not deposit BNB and only completes tasks, you can get about 36 Listas, and 0.6 U in over-the-counter transactions. The expected listing price is 1.2-1.5 US dollars. Friends who interact with tasks basically have 40-50 dollars per account. People with many accounts can still get good meat!

See original
Yesterday, Ethereum ushered in new positive news. The SEC stopped the investigation and withdrew the charges that ETH was a security. This means that Ethereum has made significant progress in compliance. At the same time, it will also promote the progress of ETH spot ETF. Coupled with the expectation of the Fed's interest rate cut, it is expected that the probability of maintaining the interest rate unchanged in August is 90%. There will be one interest rate cut this year, which is expected to be in December. The delay in the expectation of interest rate cuts and the closing of call options by whales have accelerated this decline. Next, it depends on whether the Ethereum ETF can be officially launched on July 2. 3650 is the key point on the disk. Breaking through and stabilizing will start a new round of trends, otherwise it will continue to fluctuate! #美联储何时降息? #趋势分析 $ETH $BNB $IO


See original
[Yingbei Trend Quantification 618’s strategy on io]
1. K-line pattern:
- The K-line has shown significant fluctuations recently. The previous week (June 10, 2024) there was a positive line with long upper shadow line and lower shadow line, indicating that the competition between the long and short sides is fierce.
- The K-line of the latest week (June 17, 2024) is a negative line with a long lower shadow. The closing price is significantly lower than the opening price, showing strong selling pressure.
2. Technical indicators:
- MACD: 4-hour MACD dead cross on June 17, short positions increase
- RSI: Entering the overbought zone and starting a pullback.
- EMA: The short-term moving average (such as EMA7) may quickly cross the medium and long-term moving average (such as EMA30, EMA120) downwards, forming a dead cross signal.
3. Trading volume:
- The trading volume in the previous week was extremely large (1726886365), which shows that the market activity is very high and the long-short game is intense.
- Trading volume decreased significantly in the latest week (261271899), but still remained at a relatively high level, indicating that market sentiment has cooled.
[Trend Determination] io is bearish in the short term, pay attention to the intraday support of 3.5, the intraday pressure of 4.2, the next target for upward breakthrough is 4.6-4.9, and the downward break is for 3-2.3. Pay attention to the mining cost as a bottom reference.
[Analysis of pressure support level]
- The first support level: around 3.5 (reason: close to the previous low, close to the lower edge of the wedge triangle)
-The second entry position is in the range of 3.05-2.9
-The third entry position is the key support 2 in the range of 2.5-2.3. If it breaks 2, it will look at 1.6 (Fibonacci golden section 23.6% support)
- Upper target: 3.9-4.5-5-5.4-6. Note that 5.1 is the trend channel pressure level and will be stepped back.
- The second target area: if you stand firm at 5, you can enter the next upward trend, see 6-6.5, and in the long term, see 8-10#io.net #io项目 #depin $IO


See original
[A new scam that must be seen in OTC U trading]
A new OTC scam, WeChat friends buy oil, the screenshot of Alipay transaction is normal, the payment is also normal, the money is received by U and transferred to the designated address, and the normal transaction process is over. As expected, an unexpected thing happened. A few hours later, the payer called and said that he had not received U and asked if U had been transferred? Then we found out that he was looking for an OTC acceptor to buy oil. He had traded with this acceptor before. Today, because he was in a hurry, he found this OTC acceptance to buy again. He transferred the money to the account given by the other party as required, but the other party said that he had not received U yet, and then said that he would refund him the next day. After seeing this, have you figured out the routine of this scammer?
Let's sort it out: For the first time, the scammer used different WeChat to create different circle of friends, and then used different WeChat to contact different people, and used the OTC acceptance's WeChat to contact customers. Because of the transaction, the customer will also lower his guard and pay as required. Use the WeChat account of a normal user to contact the seller. Because there are friends who have traded before, the seller will check the transaction flow normally and transfer the money to U after receiving it. Moreover, Alipay cannot receive the real name of the payee. Even if you see something different, the other party will say that I used my family to pay, and you will agree. In this way, if there is a problem, the scammer will cheat the oil away, and the victim will give the money to the oil seller. Even if the victim reports the hat uncle, he can only chase the funds but not the oil. Moreover, if the seller cannot provide effective evidence, he may lose both oil and money. Moreover, such routines basically have friends for a period of time or even have transactions. There is no problem with small amounts at the beginning, and then one day a large amount will be swept away.
[Preventive measures] The first choice for selling oil is to require the buyer to provide transaction flow and KYC, and then ask the buyer to pay in person. Use WeChat communication to verify WeChat real-name authentication (verify whether the name is consistent before transferring money). If you use Alipay, you must also verify whether it is paid by yourself. If it is a third-party payment, the safest thing is to refuse.
You must also find a reliable party for over-the-counter oil purchases and over-the-counter acceptance or guarantor, so that you can't get the oil after the money is paid. Also, the market price has standards, and you need to be careful if it is much higher or lower than the standard, because something must be wrong when it is abnormal. Also, whether you are a friend or not, or if a friend introduces you, you must follow the rules, because if there is a problem, the loss is yours, so don't be afraid of trouble or affecting the relationship.#USDT。
See original
BNB surged to 630 on June 3, and rose all the way to 715, a 19% increase in 3 days. On June 6, Binance's new coin mining phase 55 was launched, IO.NET, a decentralized artificial intelligence computing and cloud platform. Users can get rewards by investing BNB and fusdt in the IO mining pool on the Launchpool website after 8:00 am on June 7, for a total of 4 days, and it will be online for trading at 20:00 on the evening of June 11. This is the first launch of IO. After the announcement, BNB surged from 700 to 721 again, and then went down all the way. After the mining was over, it had returned to 615, a drop of nearly 16%. That is to say, if you enter the market at 700 after the announcement of short-term mining, you will lose 15% after the end. According to the historical mining income of 1%-2%, it is speculated that the IO listing price is expected to be in the range of 6.5-13. io.net is a decentralized artificial intelligence computing and cloud platform on the SOL chain. By aggregating GPU supply from underutilized resources, io.net creates a network that allows machine learning (ML) startups to obtain nearly unlimited computing power at a fraction of the cost of traditional clouds.
io.net has raised $400 million through two rounds of private placements, with the latest valuation of $1 billion, and has received support from Solana, RNDR, and FIL. This accounts for 36.24% of the Genesis token supply and 22.65% of the maximum token supply.
As of June 6, 2024, the fixed maximum supply is 800 million tokens and the Genesis supply is 500 million tokens. The circulating supply after listing will be 95 million (about 19.00% of the Genesis token supply). According to the market value data, the estimated opening price is around US$5, and the key pressure is around US$10. #第55期新币挖矿IO #IO价格预测 #BNB金鏟子 $BNB

See original
Binance's new coin mining phase 55 is online, IO.NET, a decentralized artificial intelligence computing and cloud platform. Users can get rewards by investing BNB and fusdt in the IO mining pool on the Launchpool website after 8:00 am on June 7, for a total of 4 days. Trading will be online at 20:00 pm on June 11. It is worth noting that this is the first launch of IO. io.net is a decentralized artificial intelligence computing and cloud platform on the SOL chain. By aggregating GPU supply from underutilized resources, io.net creates a network that allows machine learning (ML) startups to obtain nearly unlimited computing power at a fraction of the cost of traditional clouds.
The core elements of the IO ecosystem include the io cloud cloud platform, which allows developers to use computing power in the IOG network to virtualize infinitely scalable and configurable clusters on demand.
IO Worker: Provides users with a comprehensive and user-friendly interface to effectively manage their GPU node operations through an intuitive web application.
IO ID: Universal identity management for the IO ecosystem.
IOG Network: Also known as the GPU Internet or "IOG", the IOG Network is a decentralized physical infrastructure network consisting of independently operated geographically distributed hardware nodes that provide permissionless access to on-demand computing.
IOG Framework: An open source, developer-friendly SDK that enables builders to deploy products and services on the GPU Internet.
io.net has raised $400 million through two rounds of private placements, with a latest valuation of $1 billion, and has received support from Solana Official, RNDR, and FIL Official. This accounts for 36.24% of the Genesis Token Supply and 22.65% of the Maximum Token Supply.
As of June 6, 2024, the fixed maximum supply is 800 million tokens, and the Genesis Supply of TGE is 500 million tokens. The circulating supply after listing will be 95 million (about 19.00% of the Genesis Token Supply). According to the market value data, the estimated opening price is around 5, and the key pressure is 10

See original
【Binance web3 latest Megadop】
Binance has launched the second phase of #Megadrop, with the first phase BB reward up to 50U, and the second phase will also be launched.
Lista DAO is a decentralized stablecoin lending protocol powered by LSDfi. Users can stake and liquid stake on Lista, and can also borrow lisUSD based on various decentralized collateral. Lista aims to use innovative liquid staking solutions to make lisUSD the number one stablecoin in the cryptocurrency field.
Investment background:
Received $10 million in funding from Binance Labs
Participation tutorial:
1. Prepare ≥ 0.012BNB in Binance WEB3 wallet
(You can directly transfer 0.012BNB through the exchange)
2. Banner advertisement on the homepage #MegadropLista]
3. Scroll down and click [Do the task] - [Start now]
4. Click [Connect] on the event page - Select [Binance WEB3 wallet] - Click [Stake] - Max quantity - Click [Stake] - Wallet interaction, the page prompts success
Note: At least 0.01BNB is pledged
5. Return to MegaDrop, click [Verify], and the task is completed
6. bnb regular financial management customers can get 1.5 times the points after completing the task
Event time: 5.30-6.20

See original
[Yingbei Trend Quantitative ORDI Trend Analysis on May 31st]
1. K-line pattern:
- The recent K-line has shown an obvious upward trend, especially the big positive lines on May 30 and 31.
- In the early stage, there was a period of shock consolidation from May 23 to May 29, and then it broke through and moved upward.
2. Technical indicators:
- MACD: The MACD histogram turns from negative to positive, and the DIF line crosses the DEA line to form a golden cross, indicating that the strength of the bulls has increased.
- RSI: The RSI value is 65.22, which is close to the overbought zone, but has not yet entered an extreme overbought state, indicating that the market still has upward momentum.
- EMA: The price has exceeded EMA7 (44.500) and EMA30 (42.335), and is much higher than EMA120 (49.830). The short-term and medium-term moving averages are arranged in a long position, with strong support.
3. Trading volume:
- On May 30, the trading volume increased significantly to 1870385, accompanied by a sharp increase in price, indicating a large influx of funds.
- On May 31, the trading volume fell back to 647083, but still maintained a high level, indicating high market activity.
[Trend Determination] ORDI is bullish in the short term. Pay attention to the intraday support of 48 and the intraday pressure of 52. If it breaks upward, the next target will be 53-55. If it breaks down, it will fall back to 45 and 43.
[Analysis of pressure support level]
- The first support level: near 45 (reason: close to the upper edge of the previous shock range, and close to the EMA7 support level)
-Second entry level: around 43.2-around 41.5, long stop loss point: 40.5 USDT, the upward trend is over, breaking 40 will return to the range of 37-33.
- Upper target: 52-55.5. Note that 56 is the trend channel pressure level and will be stepped back.
- Second target area: 60 -62-, 62.2 is the 61.8% Fibonacci golden line. This is regarded as a key trend change level. A breakthrough means entering the next upward cycle. #ordi #ORDIUSDT #趋势分析 $ORDI

See original
[Yingbei Trend Quantitative Hotspot Analysis on May 30]
Auction was launched in the Korean won trading area yesterday, directly pulling up nearly 50%, with a circulation of 6.5 million pieces, a maximum supply of 10 million pieces, a circulation market value of 159 million US dollars, an issue price of 0.8 US dollars, and a historical high of 70.5 US dollars. Bounce is a decentralized token exchange platform built on Ethereum and Binance Smart Chain. The platform allows users to establish token exchange pools with fixed or dynamic exchange rates. From November 20 to December 20, 2023, it rose from 9 US dollars to 48.7 US dollars in one month, an increase of more than 500%. The lowest callback in this round was 12.7 US dollars, and the callback range was nearly 75%.
[Technical indicator analysis] On May 20, it rebounded after hitting the support of the lower Bollinger track of the daily line. At the same time, the MACD golden cross bulls increased the pressure of the upper Bollinger middle track 16, and the pressure of the upper Bollinger track was 18.5 US dollars. After entering the Korean won zone yesterday, it broke through the upper track with a large volume, reaching a maximum of 31.5 US dollars, and fell under the pressure of the upper Bollinger track of the monthly line. The current price is 24.5 US dollars, and it is expected to fall back to the upper Bollinger track of the daily line at around 22.5 US dollars.
[Trend prediction] Oscillating upward, upper target 30-33--35-39-42-48
Strategy retracement support can be entered in batches, lower support is 23-22.5 range, breakout is around 21.1-21.3
20.3-19.5 and finally 18-17.5, can be divided into 4 entries.
The market value of this token is small and the volatility is large, the above analysis is for reference only. #Auction #涨幅榜 #趋势交易

See original
[Yingbei Trend Quantitative Analysis of Hot Coin Trends on May 29]
The meme trend of Ethereum has spread to Shib , intraday increase of 15%, daily bullish volume, MACD golden cross, sprinting to 0.0000287 pressure, after breaking through, it will go out of the wedge triangle oscillation zone and break into the next rising range. It is worth noting that the pressure above 0.00003 will be stepped back. Breaking through and standing firm at 0.00003, the second target is 0.000033, the third target is 0.0000375, and the fourth target is 0.000041. Standing firm at 0.00004 is expected to sprint to the previous high of 0.0000456. The mid-term is bullish, and the callback can be entered in batches. Callback support: 0.0000277-0.0000268-0.00002575-0.0000251
#meme板块关注热点 #SHIBI $SHIB

See original
[Yingbei trend quantitative analysis] Trend strategy analysis on May 28
1. K-line pattern:
- Recently, the price has been fluctuating around 600, entering the tail of the wedge triangle, and the amplitude of the shock has decreased, waiting for a new direction.
- A big positive line appeared on May 21, 2024, reaching the trend pressure point of 630. There were signs of a correction in the following days.
2. Technical indicators:
- MACD: Both DIF and DEA are positive, but the MACD histogram shows a gradually shortening trend, indicating that bulls are weakening.
- EMA: EMA7 (600.1) is close to the current price, EMA30 (590.8) and EMA120 (514.7) present a bullish arrangement, and the long-term trend is still upward.
3. Trading volume:
- On May 23, 2024, the trading volume increased significantly, reaching 607672. Along with the price decline, it showed that the selling pressure was heavy.
- Trading volume has decreased in recent days and market sentiment has stabilized.
㊙️bnb is currently oscillating in the range of 594-611. Since the weekly long volume is less than the daily long volume and the short volume trend is increasing for 4 hours, there is a callback demand in the short term.
[Trend Strategy Analysis] The recent trend is concussive and downward, and the rebound is under pressure 🈳️The upper pressure is 603.5-606-608.5-613, the short stop loss is 616
The lower support is 590-583.5-580, long stop loss is 579
If you break below 573-562-550-538, you can receive spot goods in batches, and wait for the next announcement of new currency mining.
#BNB走势 #BNB金铲子挖矿 $BNB


Explore the lastest crypto news
⚡️ Be a part of the latests discussions in crypto
💬 Interact with your favorite creators
👍 Enjoy content that interests you
Email / Phone number
Trending Topics
BinanceTurns7
626,058 views
275 Posts
#BinanceTurns7 Come celebrate 7 years of Binance with us to unlock digital badges and win some exclusive 7YA swag!
Task 1: Share Your Binance Birthday Wishes to Unlock the Basic 7YA Digital Badge
- Complete the setup of your Binance Square profile (e.g., username, profile, biography) and follow this account @Binance_Square_Official during the Activity Period.
- Comment on this Binance Square official post with your Binance birthday wishes, and ensure that your post includes the #BinanceTurns7 hashtag to unlock the basic 7YA digital badge.
Task 2: Post Your Favorite Binance Memories to Unlock the Upgraded 7YA Digital Badge & Binance 7YA Merch
- Users who successfully complete Task 1 may receive an upgraded version of the 7YA Digital Badge by sharing their fondest memories with Binance in a new Binance Square post that mentions the #BinanceTurns7 hashtag during the Activity Period.
- On top of that, the top seven participants with the highest total number of engagements (i.e., likes, shares, comments, quotes) for a qualified post in Task 2 during the Activity Period, will each receive one set of Binance 7YA merch.
Terms and conditions:
- 7YA digital badges will appear next to the profiles of qualified participants within four working days after the promotion ends.
- Winners of 7YA merch will be notified via a push notification under Creator Center > Square Assistant, within four weeks after the promotion ends.
- Users should complete the required instructions within the timeframe stipulated in the push notification to successfully receive merch rewards. Please note that winners should provide a valid shipping address, and will be responsible for any taxes, if applicable.
- No refunds or cash equivalent value of the rewards will be granted.
Binance Square Official
1.1k Likes
44k views
bitcoin
20.8M views
5,698 Posts
Binance
23.4M views
11,783 Posts


