PhD QAMD
@QAMD
Market Analyst, Researcher, Data Scientist, Educationist, Fundamental and Technical Analysis
Following
Followers
Liked
Shared
🔥🔥Top 5 coin for 2024-25 with 10x-20x potential and beast for long run🔥🔥
1. Injective ($INJ ):
-Market cap: $2.3billion
- Current Price: $24.5
- Future Price (2024-25)**: Expected to range between $250 to $400 it is already established as a prominent Layer1 protocol.
2. Ordinals($ORDI ):
-Market cap: 800million
- Current Price: $38.4
- Future Price (2024-25): Expected to range between $400 to $600 driven by its feature(NFT, inscription of text and pictures, audio and video) and limited supply.
3. Fetch.AI ($FET ):
- Market cap: 2.5billion
- Current Price: $2.3
- Future Price (2024-25): Expected to range between $20 to $30 driven by recent boom and development of AI projects, partnerships, and infrastructures.
4. Saga ($SAGA):
- market cap: 270million
- Current Rate: $3.0
- **Future Rate (2024-25): Predicted to surge between $30 to $50, driven by its scalability features and project development within the last two years and fast adoption of developers.
5. Renzo($REZ):
- Market cap: 165.3million
-Current price: 0.145
- Future Rate (2024-25)**: Estimated to grow to $2 to $3 as it secures AVSs and higher yielding than ETH, and becomes increasingly important for cryptocurrency space due to strategy manager for eigenlayer.
Please press follow for more information and updates. Your follow means a lot and motivates me to do more research and discuss good projects. Thank you.
All these predictions are speculative and subject to change based on various factors such as market trends, project developments and overall cryptocurrency adoption. DYOR for financial activities. NFA.
#CryptoWatchMay2024 #ai #BTC #altcoins #Memecoins


🚨Market sentiments price action and data check.🚨
✅ Two different trend are presented
1) Descending channel movement.
2) Historical Long term bull/bear market trend.
1) In our previous post we analyzed the movement of btc in detail using a descending channel. It is still behaving as per our data analysis and holding trend. At present $BTC is above central trendline/support holding on a daily TF. Breaking this central line means expect a down one trend again. Detailed description and analysis could be checked from our previous post related to btc in descending channel.
2) In HTF bitcoin is way up above the trendline which is a bullish signal. By breaking HTF trendline is a bearish signal. Keeping the views and current sentiment of the market in future it may test trendline or even break but for the time being the market is bullish. Emotions of new traders are changing on LTF(every 15min, 1h,4h) normal in this market due to which very few are winners. HOLDing nerves and keeping emotion aside will create a chance for gaining profit not only in the bull market but even in the bear market. For the HTF chart see our analysis from the previous post.
Please press the follow button for more data check, fact and analysis. If you agree and like the idea dont forget to press follow, else suggestions are expected for improvement in comments.
DYOR for financial activities. NFA, this is only for educational purposes.
#BlackRock #Memecoins #BTC $PEPE #altcoins $SHIB #CryptoWatchMay2024


🔥💰🔥 Super Speculative Price prediction of $FLOKI and fact/data check.🔥💰🔥
✅📝-If FLOKI reach $0.000187:
A $1000 investment would result in acquiring approximately 5.34 million tokens. If FLOKI were to reach the $0.00187 price target, these 5.34 million tokens would escalate in value to $10,000, yielding a notable return of over $9000.
📊Data and Fact:
Market cap at $0.000187: $1.82billion
To achieve $0.00187 market cap should be $18.2billion i-e., Equivalent to market cap of DOGE
📝- In the scenario if FLOKI achieves $0.0187:
The same initial investment of $1,000 would see the 5.34 million tokens valued at $100,000, potentially generating profits of up to $99,000, with great ROI.
Data and Fact:
Market cap at $0.000187: $1.82billion
To achieve $0.0187 market cap should be $182billion i-e., approximately 3-times the market cap of $SOL
📝- In case, if FLOKI achieves $0.187:
With the same initial investment of $1,000 would see the 5.34 million tokens valued at $1,000,000 racking profits up to $999,000, with a super duper extraordinary ROI.
Reality and Fact check:
Current market cap at $0.000187: $1.82billion
To achieve $0.187 market cap should be $1.82 trillion i-e., 1.5-times current market cap of #BTC
📝Please press follow for more informative facts and realistic data checks. Your follow motivates me to do better research for the community. Thank you.
📝 Before any investment always check fact and figures, don't just blindly throw your hard earn money. Despite these optimistic forecasts, it's crucial to remember the speculative nature of cryptocurrency investments, emphasizing the importance of conducting thorough research and only investing what one can afford to lose. DYOR for financial activities. NFA.
#Memecoins #bitcoinhalving #BTC #altcoins $PEPE #ElonsMusk


🔥💰🔥Top 7 Facts on Crypto Millionaires🔥💰🔥
✅📝There’s more than 88,200 crypto millionaires.
✅📝Out of these 88,200 people, 40,500 millionaires made their fortune with Bitcoin.
✅📝Bitcoin alone has created six billionaires since its inception in 2009.
✅📝By 2023, the global count of crypto billionaires has risen to 22, a slight increase from 19 in 2022.
✅📝Satoshi Nakamoto, the anonymous creator of Bitcoin, holds 1 million BTC.
✅📝A report from March 2020 suggested that there were nearly 95,000 Bitcoin millionaires at the time.
✅📝82% of millionaires choose Bitcoin as their cryptocurrency.
Source: Henley & Partners, Forbes, Fortune, The Motley Fool, OriginStamp, FinTech Magazine.
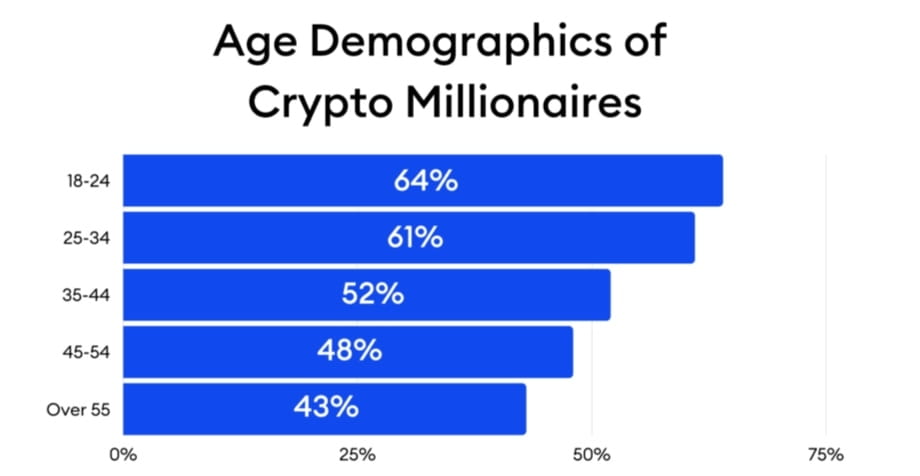
🔥💰💰🔥Age Demographics of Crypto Millionaires.🔥💰💰🔥
Age group Cryptocurrency adoption
18-24 64%
25-34 61%
35-44 52%
45-54 48%
Over 55 43%
https://www.researchgate.net/publication/345643483_Exploring_Perceptions_of_Bitcoin_Adoption_The_South_African_Virtual_Community_Perspective/figures?lo=1
📝📝📊📊Please press follow for more information and interesting fact checks. You follow means do more good research.
DYOR for financial activities. This is for educational and learning purposes.
#bitcoinhalving #altcoins #BTC #Memecoins #BlackRock
✅📝There’s more than 88,200 crypto millionaires.
✅📝Out of these 88,200 people, 40,500 millionaires made their fortune with Bitcoin.
✅📝Bitcoin alone has created six billionaires since its inception in 2009.
✅📝By 2023, the global count of crypto billionaires has risen to 22, a slight increase from 19 in 2022.
✅📝Satoshi Nakamoto, the anonymous creator of Bitcoin, holds 1 million BTC.
✅📝A report from March 2020 suggested that there were nearly 95,000 Bitcoin millionaires at the time.
✅📝82% of millionaires choose Bitcoin as their cryptocurrency.
Source: Henley & Partners, Forbes, Fortune, The Motley Fool, OriginStamp, FinTech Magazine.
🔥💰💰🔥Age Demographics of Crypto Millionaires.🔥💰💰🔥
Age group Cryptocurrency adoption
18-24 64%
25-34 61%
35-44 52%
45-54 48%
Over 55 43%
https://www.researchgate.net/publication/345643483_Exploring_Perceptions_of_Bitcoin_Adoption_The_South_African_Virtual_Community_Perspective/figures?lo=1
📝📝📊📊Please press follow for more information and interesting fact checks. You follow means do more good research.
DYOR for financial activities. This is for educational and learning purposes.
#bitcoinhalving #altcoins #BTC #Memecoins #BlackRock

🔥🔥💰🔥 Super Speculative Price prediction of $BONK and fact/data check.🔥🔥💰🔥
✅📝-If BONK were to reach $0.000027:
A $100 investment would result in acquiring approximately 3.7 million tokens. If BONK were to reach the $0.00027 price target, these 3.7 million tokens would escalate in value to $1,000, yielding a notable return of over $900.
📊Data and Fact:
Market cap at $0.000027: $1.78billion
To achieve $0.00027 market cap should be $17.8billion i-e., Equivalent to market cap of $SHIB/AVAX
📝- In the scenario if BONK achieves $0.0027:
The same initial investment of $100 would see the 3.7 million tokens valued at $10,000, potentially generating profits of up to $9,900, with great ROI.
Data and Fact:
Market cap at $0.000027: $1.78billion
To achieve $0.0027 market cap should be $178billion i-e., approximately 5.5-times the market cap of $XRP
📝- In case, if BONK achieves $0.027:
With the same initial investment of $100 would see the 3.7 million tokens valued at $100,000 racking profits up to $99,900, with a super extraordinary ROI.
Fact:
Current market cap at $0.000027: $1.78billion
To achieve $0.027 market cap should be $1.78 trillion i-e., 1.5-times current market cap of #BTC
📝 Before any investment always check fact and figures, don't just blindly throw your hard earn money. Despite these optimistic forecasts, it's crucial to remember the speculative nature of cryptocurrency investments, emphasizing the importance of conducting thorough research and only investing what one can afford to lose. DYOR for financial activities. NFA.
📝Please press follow for more informative facts and realistic data checks. Your follow motivates me to do better research for the community. Thank you.
#altcoins #BullorBear #Memeoins #CryptoWatchMay2024 $PEPE


🔥🔥💰🔥Super Speculative Price prediction of $WIF for longer term and fact check.🔥🔥💰🔥
📝-If WIF were to reach $33:
A $100 investment would result in acquiring approximately 33.4 tokens. If WIF were to reach the $33 price target, these 33.4 tokens would result in value of $1002, yielding a notable return of approximately $902 approximately. A 10x to the current value.
✅Fact and data check:
Current market cap at $3: $3b
To achieve $33 market cap should be $33b i-e., 2-times the current market cap of $SHIB
📝- In the scenario if WIF achieves $150:
The same initial investment of $100 would see the 33.4 tokens valued at $4,995 generating profits of up to $4,895, with an extraordinary ROI. A 48x-50x from the current value.
✅Fact and data check:
Market cap at $3: $3b
To achieve a $150 market cap should be $150billion i-e., 30x the market cap of $PEPE
📝- In case, if WIF achieves $330:
With the same initial investment of $100 would see the 33.4 million tokens valued at $11,022 racking profits up to $10,922, with a super extraordinary ROI. A 100x to the current value.
✅Fact and data check
Current market cap at $3: $3
To achieve $330 market cap should be $330 i-e., 10x-times the current market cap $DOGE
📝Please press follow for more interesting facts and data checks. Your follow motivates me to do better for the community. Thank you.
📝- Despite these optimistic forecasts, it's crucial to remember the speculative nature of cryptocurrency investments, emphasizing the importance of conducting thorough research and only investing what one can afford to lose.
The question arises on these speculations can WIF be able to achieve these targets? Comment.
#Memecoins #bitcoin #BlackRock #altcoins #altcoins $Sol $BNB $ETH $SHIB


🔥🔥💰🔥 Super Speculative Price prediction of $PEPE for longer term and fact check.🔥🔥💰🔥
📝-If PEPE were to reach $0.00007:
A $100 investment would result in acquiring approximately 14.3 million tokens. If PEPE were to reach the $0.00007 price target, these 14.3 million tokens would escalate in value to $1,000, yielding a notable return of over $900.
Fact:
Current market cap at $0.000007: $3.33billion
To achieve $0.00007 market cap should be $33.3billion i-e., 2-times the current market cap of $SHIB
📝- In the scenario if PEPE achieves $0.0007:
The same initial investment of $100 would see the 14.3 million tokens valued at $10,000, potentially generating profits of up to $9,900, with an extraordinary ROI.
Fact:
Current market cap at $0.000007: $3.33billion
To achieve $0.0007 market cap should be $333billion i-e., 5-times the market cap of $BNB
📝- In case, if PEPE achieves $0.007:
With the same initial investment of $100 would see the 14.3 million tokens valued at $100,000, racking profits up to $999,900, with a super extraordinary ROI.
Fact:
Current market cap at $0.000007: $3.33billion
To achieve $0.007 market cap should be $3.33trillion i-e., 3-times the current market cap #BTC
📝- Analysts from Changelly anticipate PEPE reaching $0.00007 by 2025 and $0.0007 by 2030.
📝Please press follow for more interesting facts and data checks. Your follow motivates me to do better for the community. Thank you.
📝- Despite these optimistic forecasts, it's crucial to remember the speculative nature of cryptocurrency investments, emphasizing the importance of conducting thorough research and only investing what one can afford to lose.
#ScamRiskWarning #BullorBear #Memecoins #bitcoin


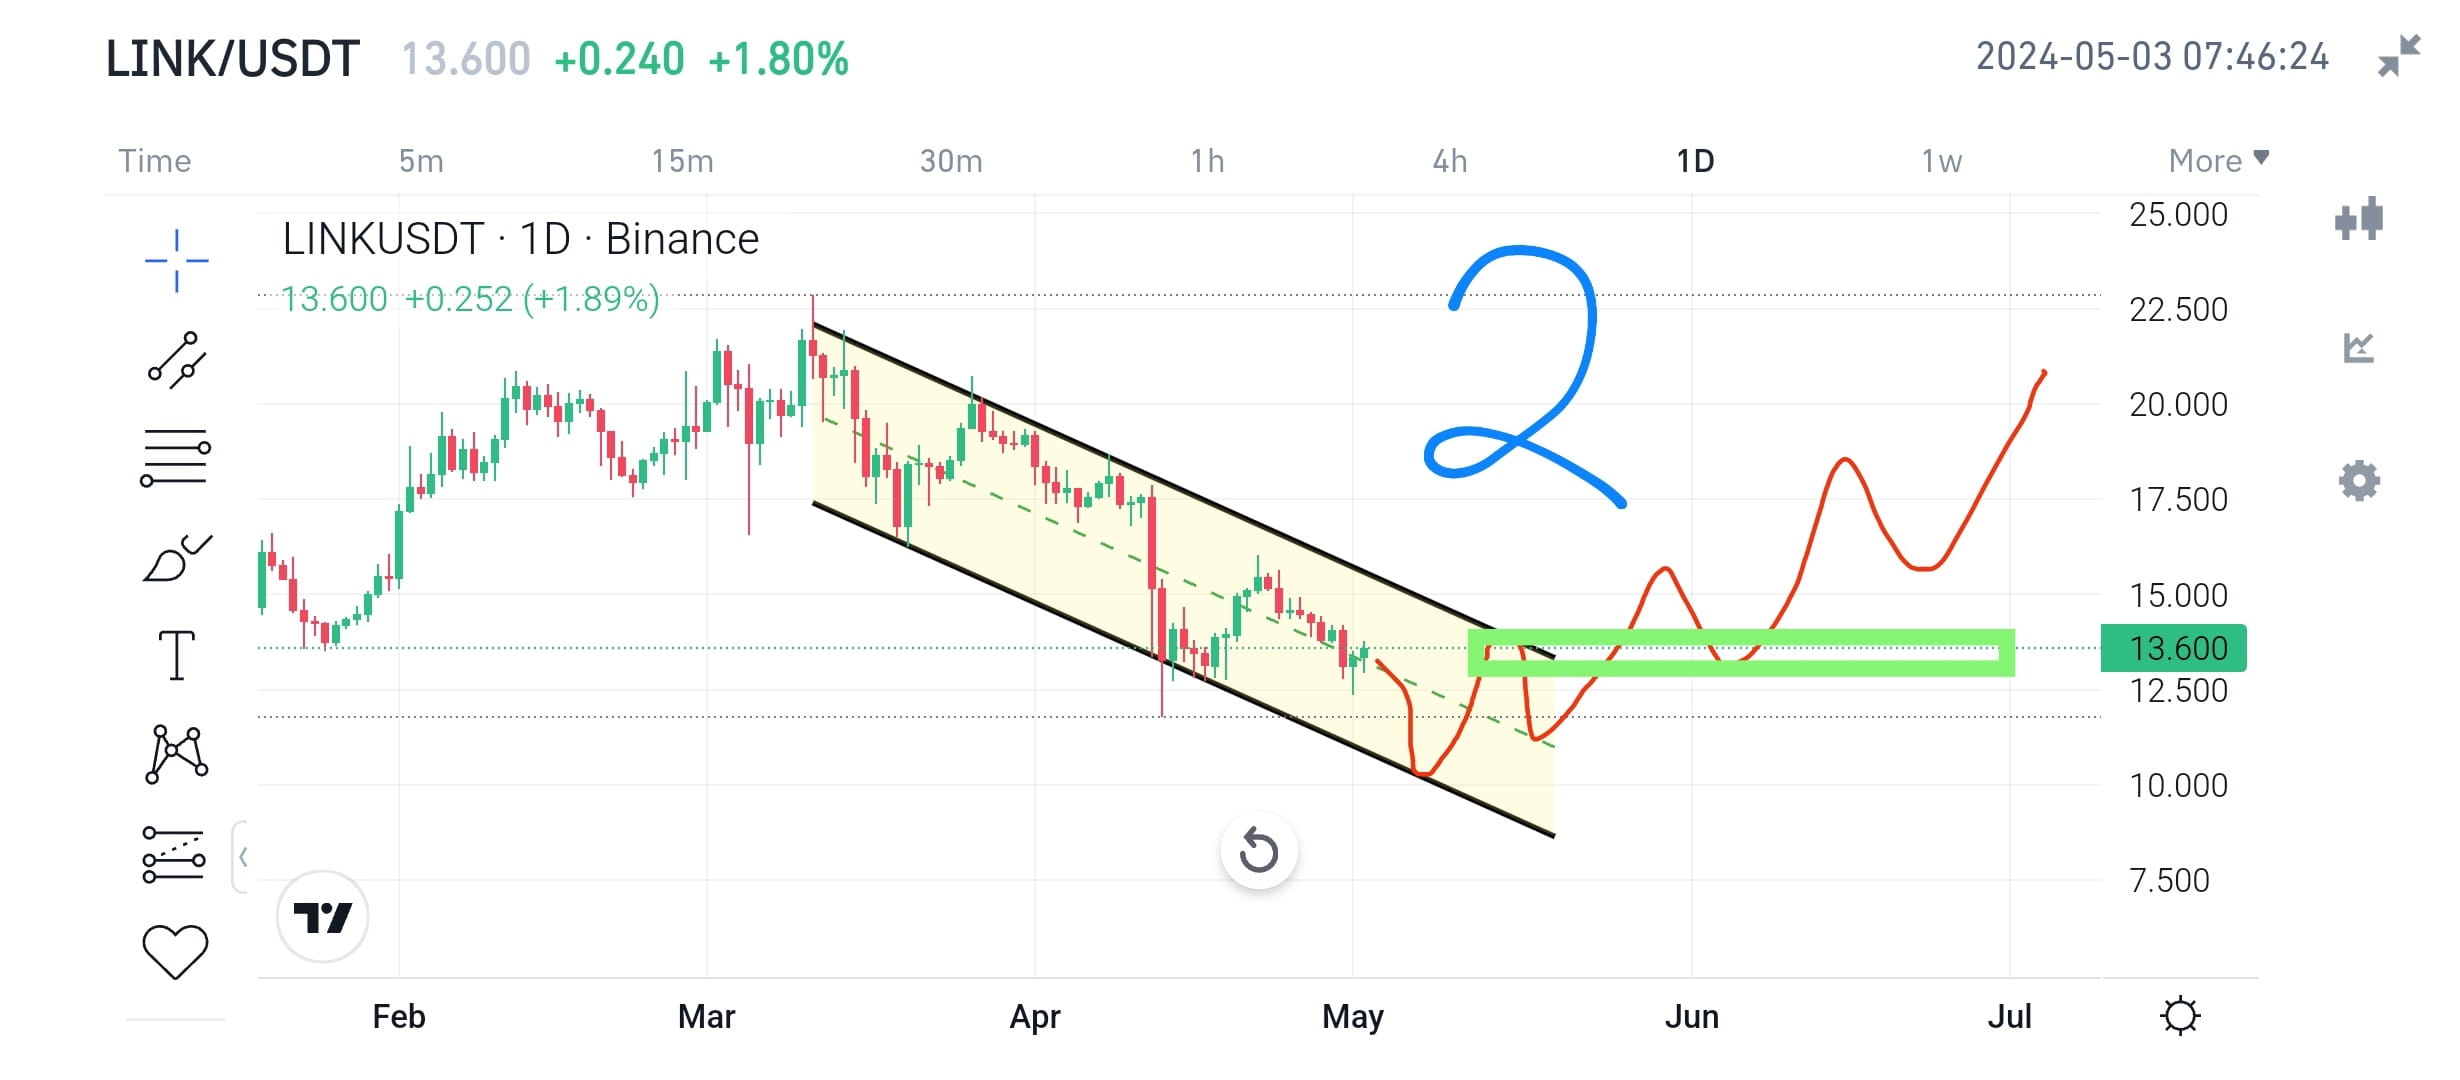
🔥💰🔥$LINK price prediction analysis from recent data and trend.🔥💰🔥
✅🔥 As displayed in figure-1 chart, The price of $LINK is moving towards the resistance of the descending channel. Need buyers volume to break that resistance, if it fails to break resistance then it may possibly retest the major horizontal support ( support is drawn using fib) zone, from where the reversal trend begins and the price might go upward in the direction.
✅🔥 Figure-2 chart displays that if $LINK continue to move in descending channel for some time. By considering current market sentiments Link may possibly fail to hold the current support/central trendline then the price probably dump towards the $9-$11 zone. It may be highly likely that prices will bounce from lower trendline/support and start up trend where it faces major resistance that need to break down to continue upward movement.
✅🔥 Spot buyers probably should do DCA, if they bought at higher price then doing DCA of $Link around central/lower support is a good idea for long term gain. It is an observation from market trends, social activities and market cap data that LINK will only do 5x-7x during the next leg of the bull market. So far, show some patience and determination for profit.
📝📢PLEASE PRESS FOLLOW if you like and agree with the idea and want more information about other crypto currencies.
🚨DYOR for financial activities. This information is only for learning and education purposes. Thank you.
#BTC #BullorBear #Memecoins #ScamRiskWarning #altcoins

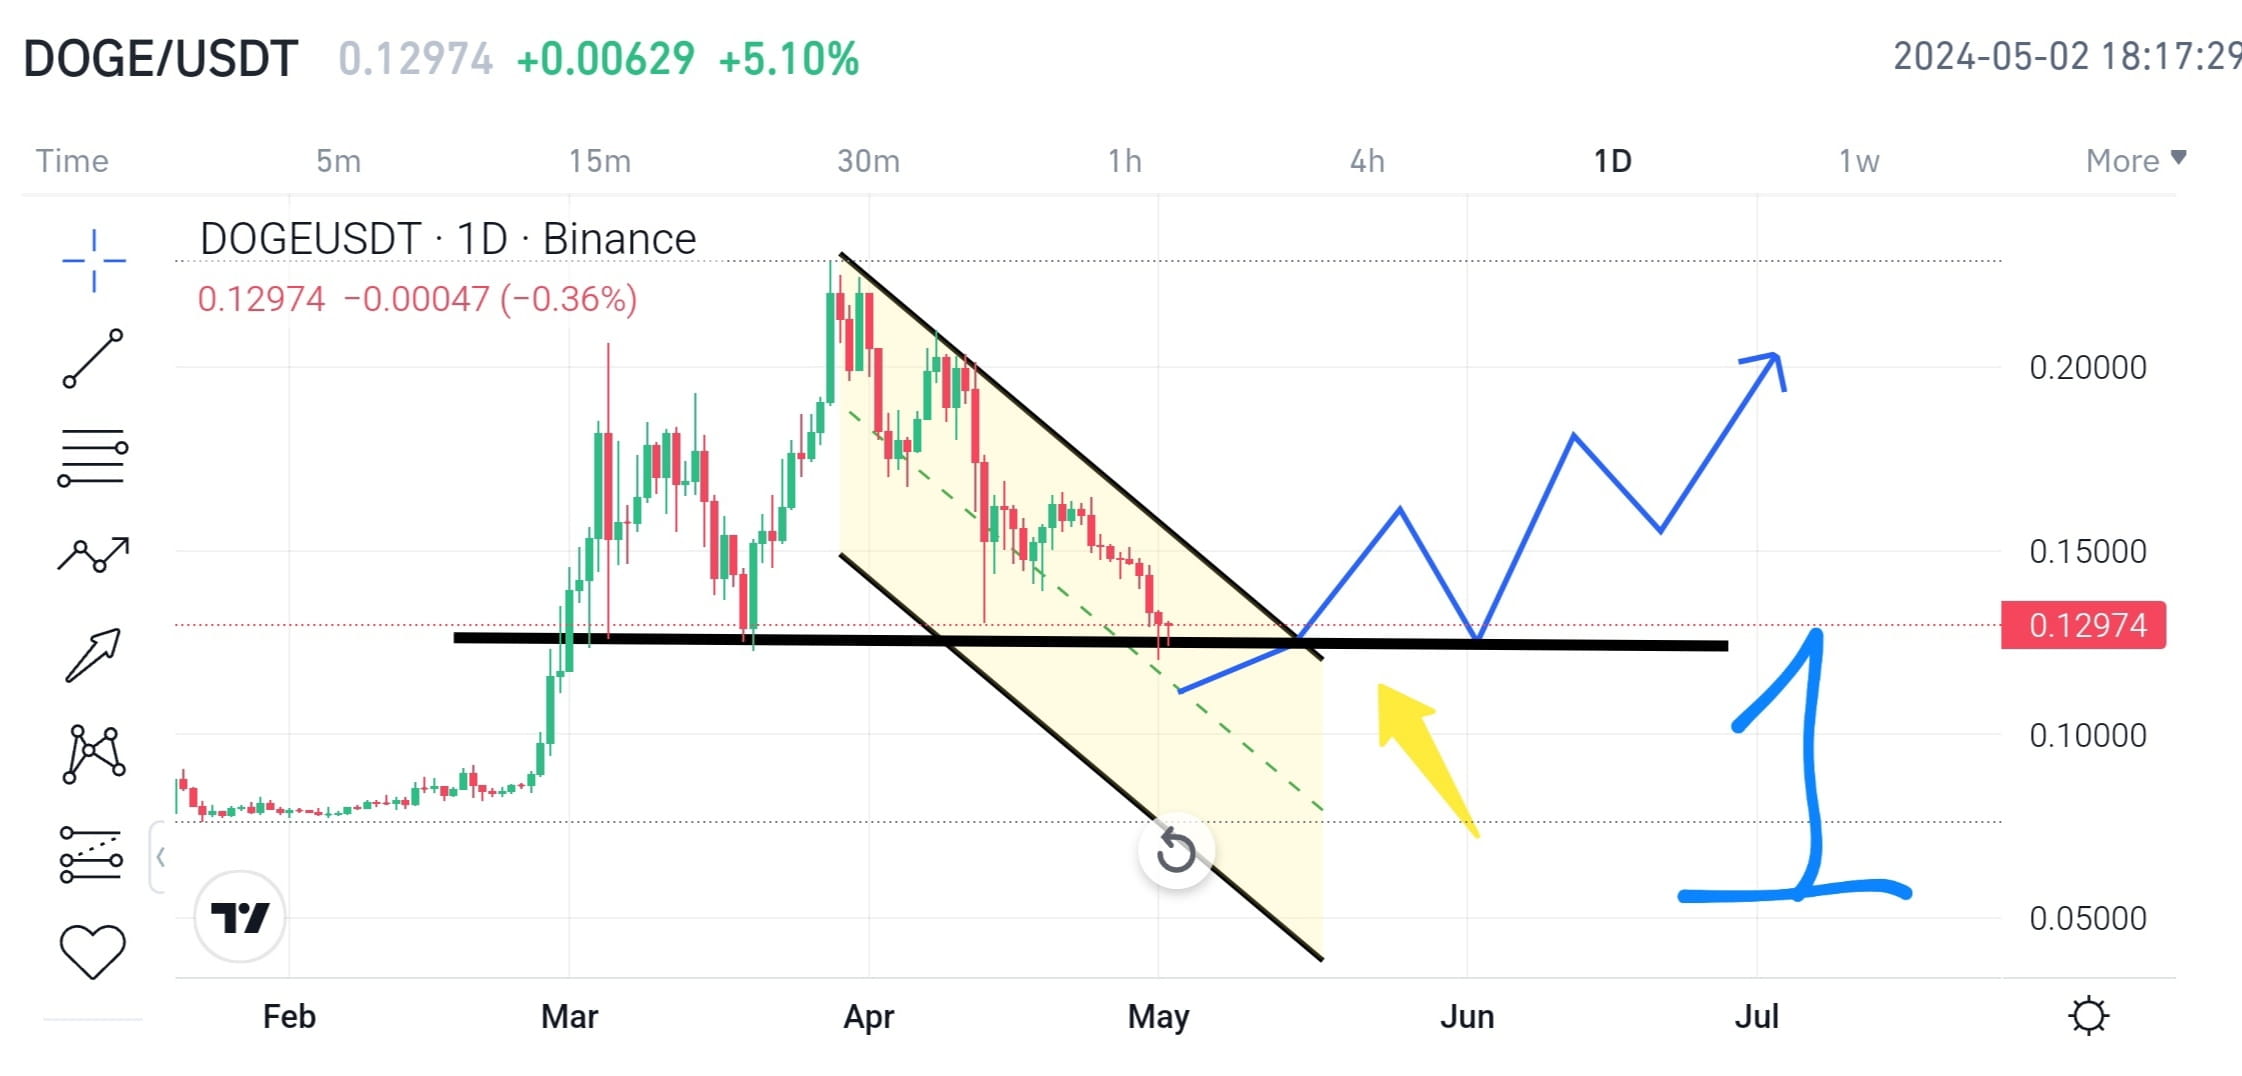
🔥🚀🔥$DOGE coin price analysis and market update.🔥🔥
✅🔥 Figure-1 shows that DOGE is moving in a descending channel. Currently it is retesting central support of a descending channel. Horizontal line support coincides with central trendline support of descending channel that makes a strong support zone for DOGE. In upward move it may probably break upper trendline and retest horizontal support after which it will possibly continue its up trend. For long buyers after retesting is a good opportunity. so keep an eye on it.
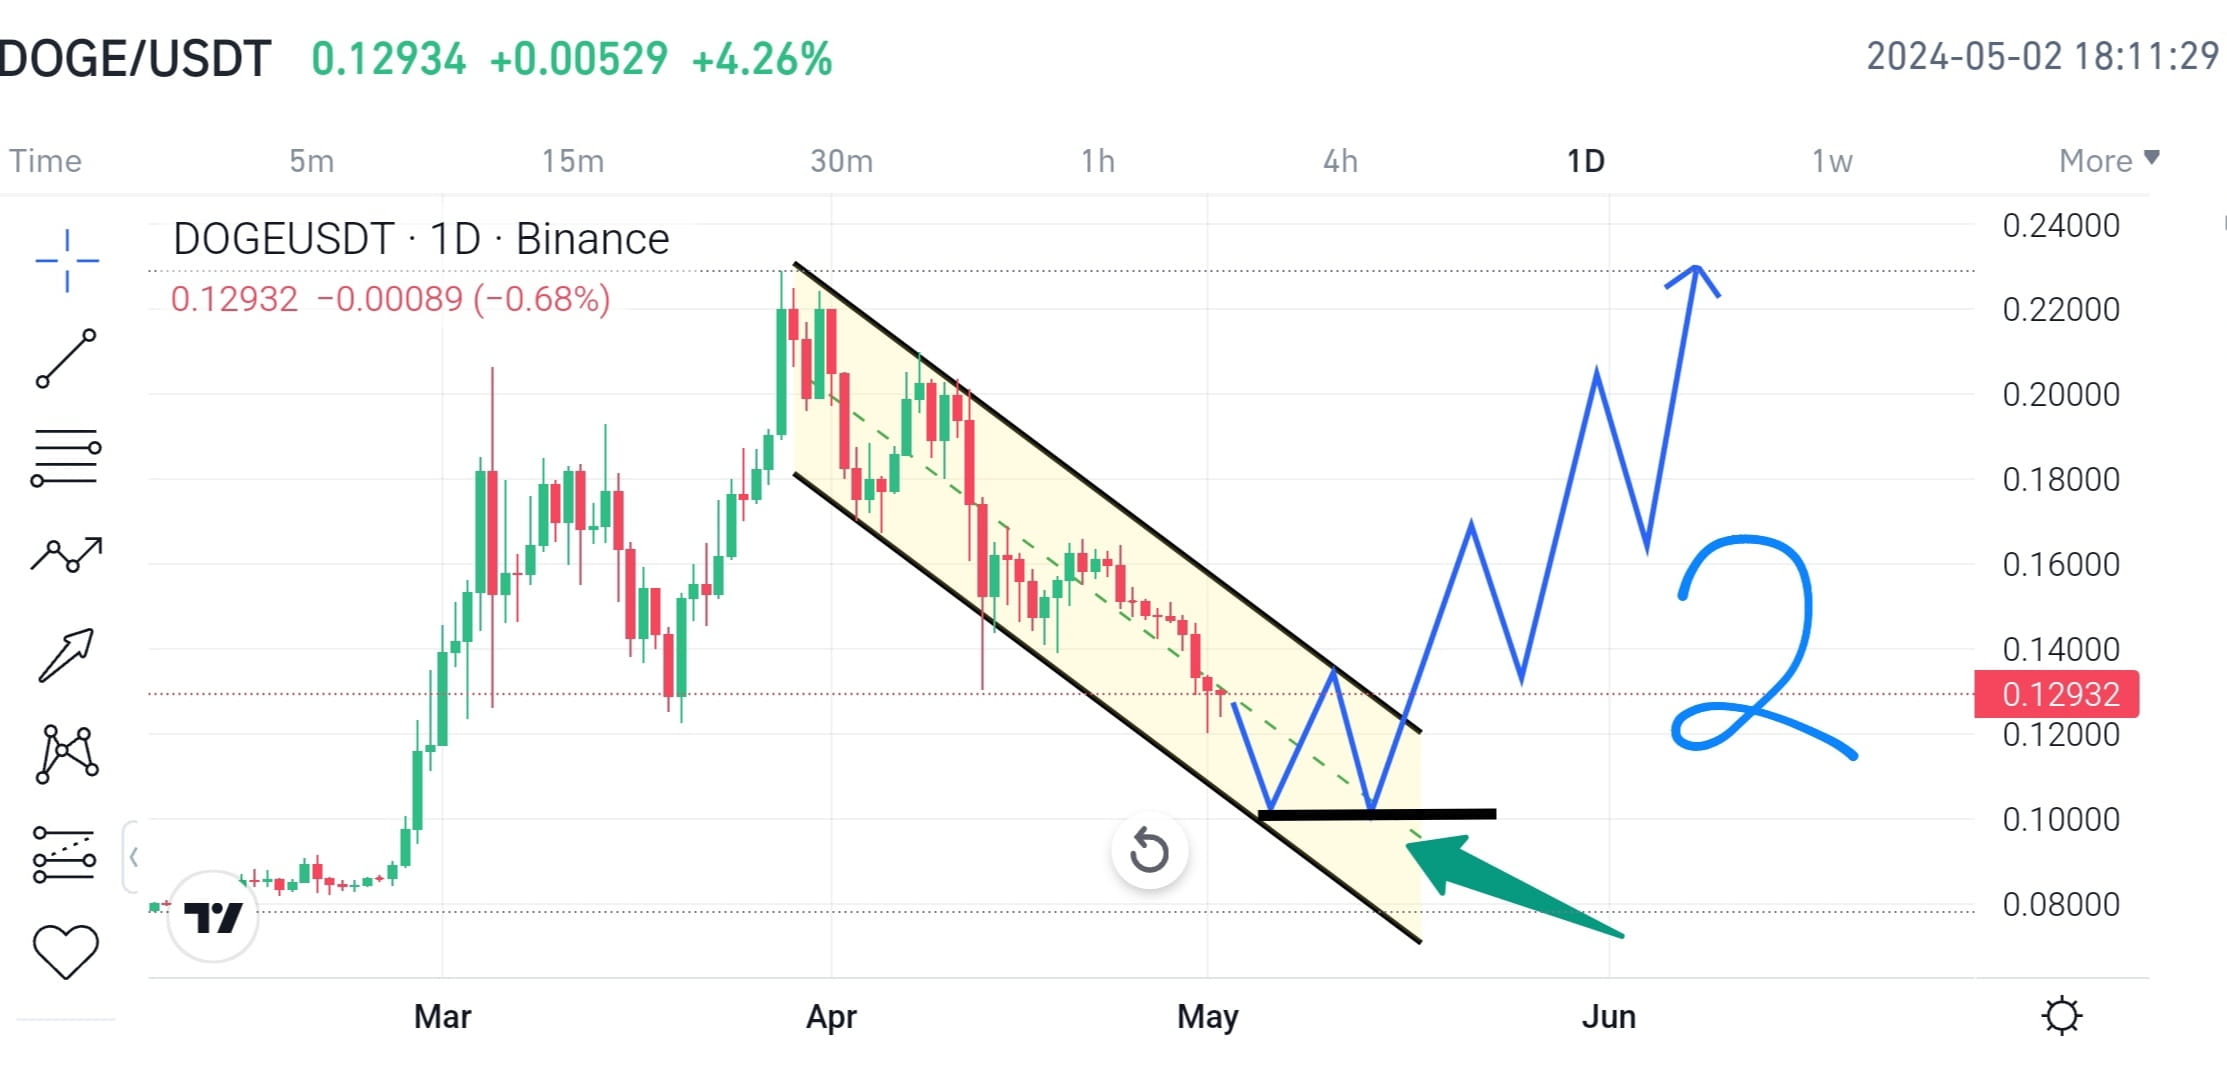
✅🔥Figure-2 reflects that, if $DOGE unable to hold central trendline/support then if will likely move towards bottom trendline/support. From where it is highly likely that it will rebound and touch the upper trend line and consolidate there for the time being. Horizontal trendline is drawn which is a strong buy zone for DOGE. This support will be crucial to determine its upward price movement. Failure will lead to a lower price which at the moment seems least likely. Rebound from this support is a good opportunity for long buyers, if retest remains successful.
✅🔥 Spot buyers may do DCA for good return during next leg of bull market. By looking at the recent trend of meme coins and market data $DOGE may probably do 6x-8x. DOGE is known as the father of meme coins.
📝Please press follow, if you agree and like the presented idea. Your following keeps me motivated to share more updates and information. Thank you
📢Disclaimer: DYOR for financial activities. This is a general perspective for learning purposes.
#Memecoins #BullorBear #bitcoin #DOGENEWS #buythedip
✅🔥 Figure-1 shows that DOGE is moving in a descending channel. Currently it is retesting central support of a descending channel. Horizontal line support coincides with central trendline support of descending channel that makes a strong support zone for DOGE. In upward move it may probably break upper trendline and retest horizontal support after which it will possibly continue its up trend. For long buyers after retesting is a good opportunity. so keep an eye on it.
✅🔥Figure-2 reflects that, if $DOGE unable to hold central trendline/support then if will likely move towards bottom trendline/support. From where it is highly likely that it will rebound and touch the upper trend line and consolidate there for the time being. Horizontal trendline is drawn which is a strong buy zone for DOGE. This support will be crucial to determine its upward price movement. Failure will lead to a lower price which at the moment seems least likely. Rebound from this support is a good opportunity for long buyers, if retest remains successful.
✅🔥 Spot buyers may do DCA for good return during next leg of bull market. By looking at the recent trend of meme coins and market data $DOGE may probably do 6x-8x. DOGE is known as the father of meme coins.
📝Please press follow, if you agree and like the presented idea. Your following keeps me motivated to share more updates and information. Thank you
📢Disclaimer: DYOR for financial activities. This is a general perspective for learning purposes.
#Memecoins #BullorBear #bitcoin #DOGENEWS #buythedip
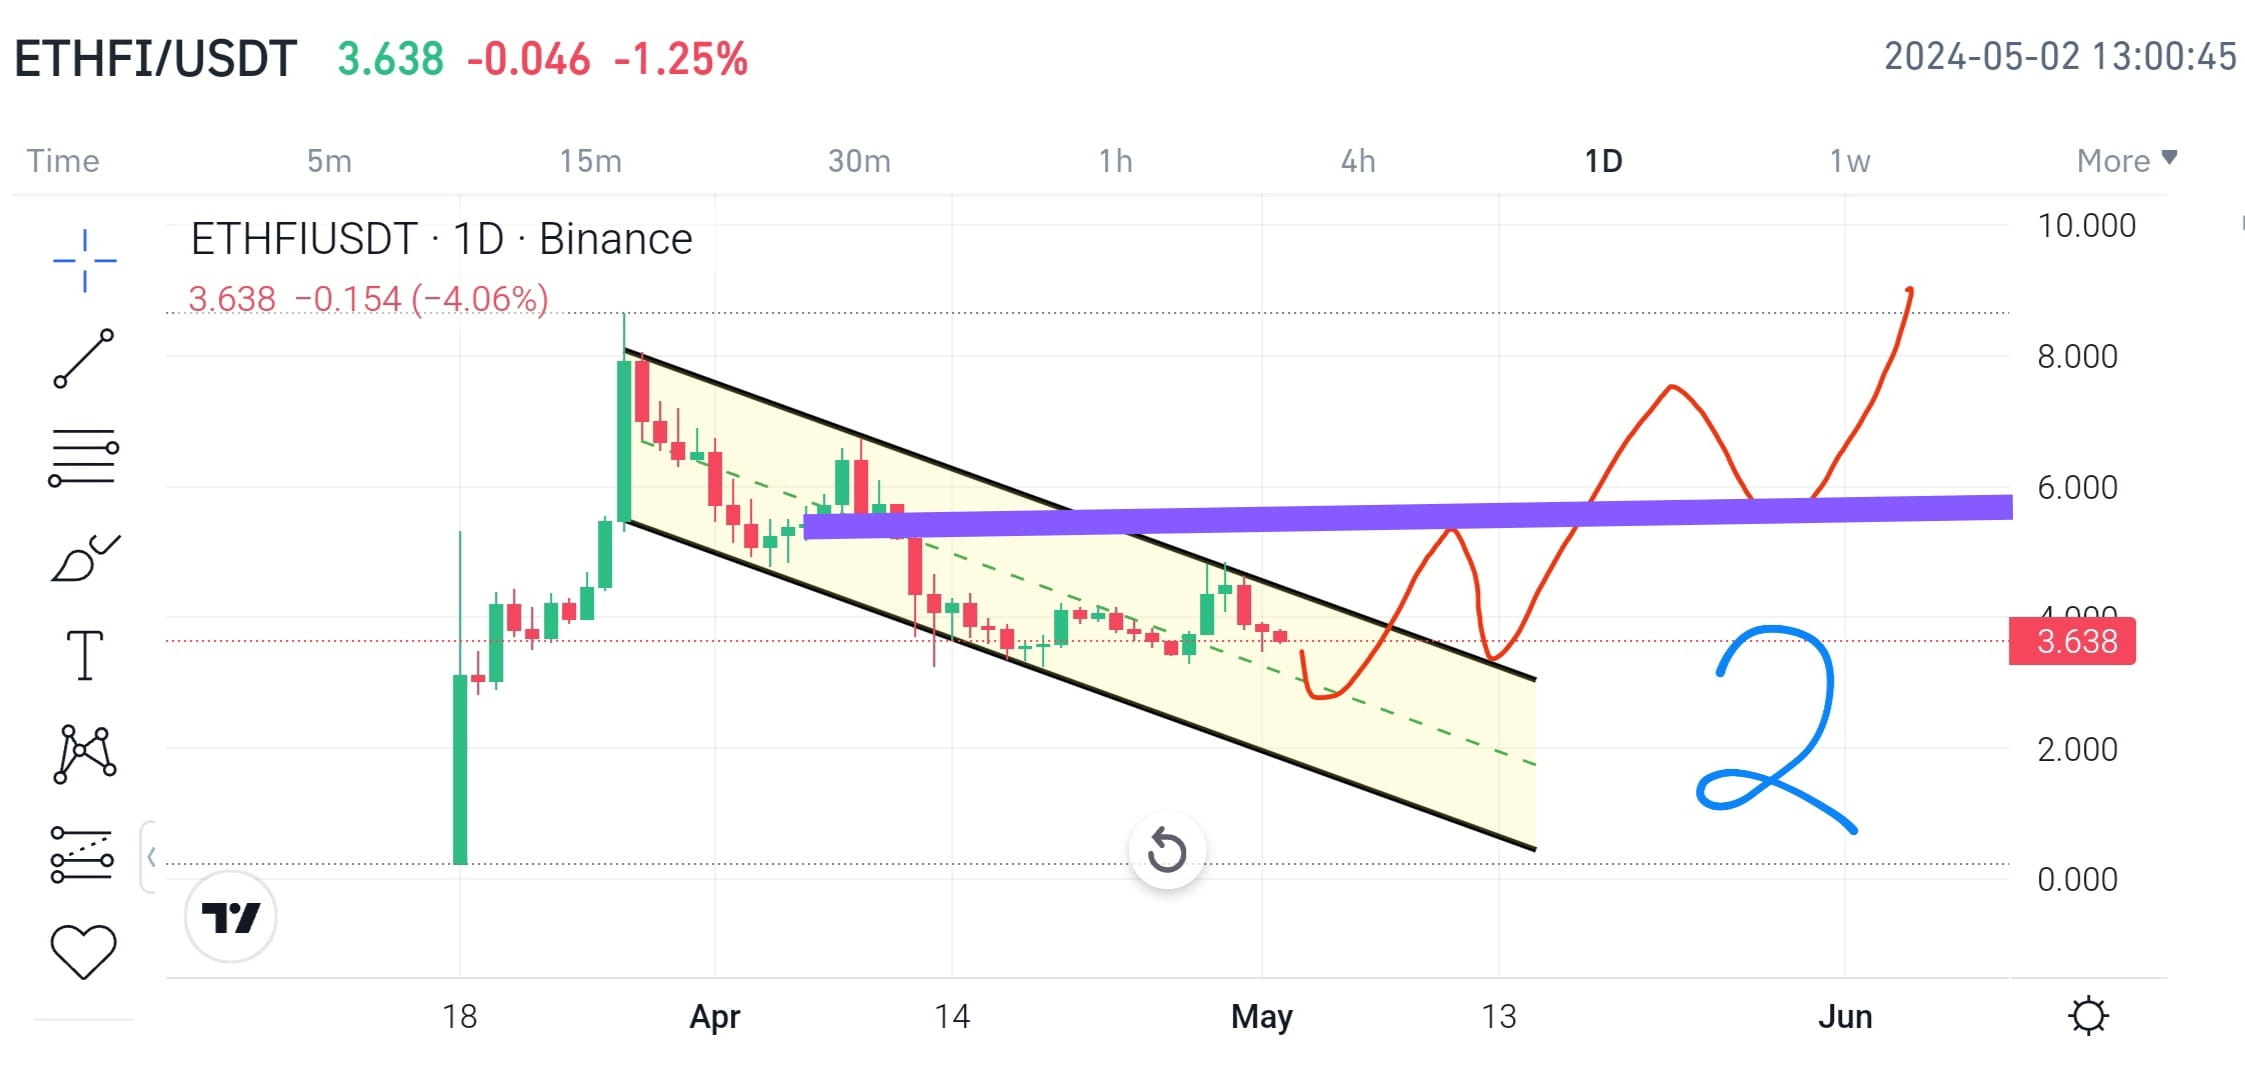
🔥💰🔥$ETHFI update and price analysis from recent trend data.🔥🔥
✅🔥 As in figure-1 possible price reaction and trend of #ETHFI🔥🔥🔥 is represented. It may Take a little dip towards central trendline/support from where it is highly likely that it will rebound towards upper trendline/resistance. But may probably consolidate between central trendline and upper trendline for the time being before any upward movement. If prices break the upper trendline then it will go much higher though before breaking ATH it will retest previous support. Currently the hype of Ether.fi gains momentum right before the next leg of the bull run.
✅🔥In figure-2 another case is represented for the probable movement of $ETHFI . It can be seen that if bounce from the central zone it will break the upper trendline/resistance. Though in this case it will probably retest the upper trendline of the descending channel for confirmation and any upper movement. It seems that ETHFI at present find support zone near the central trendline. Good opportunity for DCA near central trendline.
✅🔥From recent trend, social activities and other data it seems that $ETHFI will easily do 10x at least in the coming months. Holding and DCA would be a very good strategy. About the DCA strategy i will share an article soon. May that will help more about understanding DCA in trading.
Please press follow you agree and like the idea and for more updates and information. Your follow means courage and appreciation for me.
Before any financial activity DYOR. This is for educational purposes. Thank you.
#BullorBear #BinanceLaunchpool #buythedip #fomc

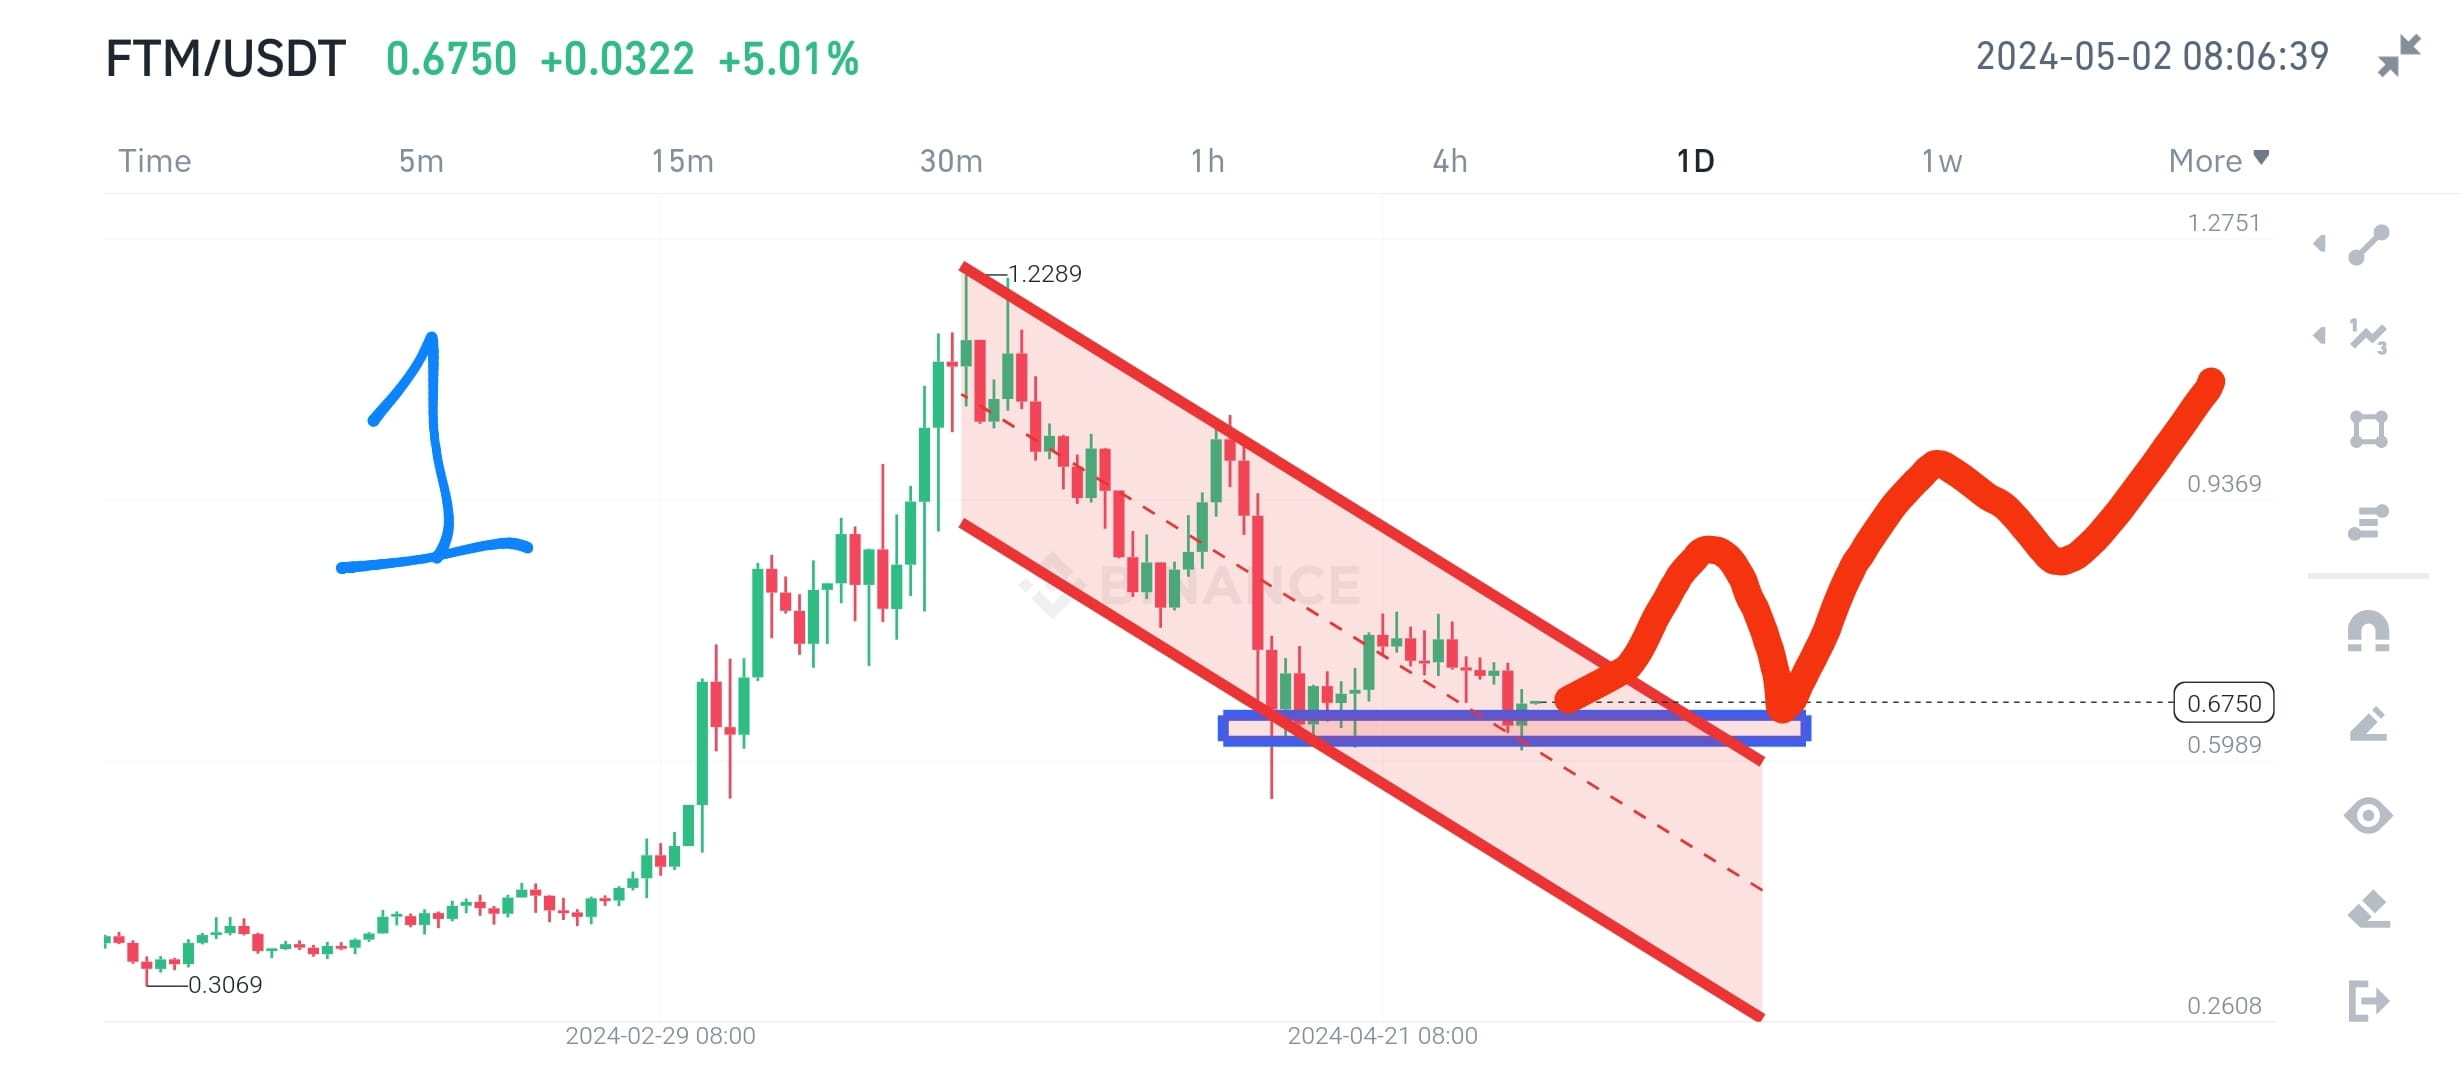
🔥💰💰🔥$FTM update and price analysis from recent data.🔥🔥💰🔥
✅🔥Figure-1 represents the current state of #FTM .It can be seen that it is still moving in a descending channel and currently lying in a very important support zone. When the market dumped/crashed/corrected/dipped yesterday FTM price also saw a dip but rebound from the support zone. We have already given analysis in our previous post, where it was mentioned that the current support zone is very important to hold. You can visit that post for further details. Link is below.
https://www.binance.com/square/post/7098220678665?ref=60984690&utm_campaign=app_square_share_link&utm_source=copyLink
Indicators effect on $FTM .
✅🚨 Indicators like MA,EMA and Bollinger Band are currently showing bearish trend.
✅🚨Indicator like RSI is in neutral zone
✅ 🚨Indicators like Volume increasing and MACD changing withing lower range.
📢🔥Overall, market sentiments are in fear/negative. Which is a good opportunity for traders to have good gains in the coming time.
🚨📝Please press follow if you agree, like the idea and for more updates and information about the market. DYOR for financial activities. The content shared here is only for learning and educational purposes
#BullorBear #Memecoins $PEPE #buythedip #BinanceLaunchpool #ScamRiskWarning
🔥🔥#Memecoins market update and important data after Cryptocurrency crash/dump.
✅$DOGE
Price: $0.12387
Down: 10.33%
Trading volume: $3b
Market Cap: $17b
Liquidation: $15m
✅$WIF
Price: $2.3206
Down: 8.15%
Trading volume: $1.19b
Market Cap: $2.33b
Liquidation: $2.17m
✅$PEPE
Price: $0.000006152
Down: 12.37%
Trading volume: $2.26b
Market Cap: $2.39b
Liquidation: $1.62m
✅$BONK
Price: $0.00002152
Down: 9.81%
Trading volume: $574m
Market Cap: $1.39b
Liquidation: 820k
✅$SHIB
Price: $0.00002102
Down: 9.16%
Trading volume: $236m
Market Cap: $12.35b
Liquidation: 1.38m
✅Overall Memes:
Down: 7.1%
Trading volume: $10.34b
Market Cap: $42b
Liquidation: $34.38m
Previously we shared analysis and charts for price action related to the memes coins. You can check and see our previous post and find interesting information about memes.
Liquidation and market cap of different category coins/tokens are given in the figure for reference. Also gains/losers are shown in figure.
Please press follow for more information and updates. Your following means a lot to me for learning and keeping myself motivated to share information and data. DYOR for financial activities. Thank you.
#BullorBear #BTC #MarketSentimentToday #fomc


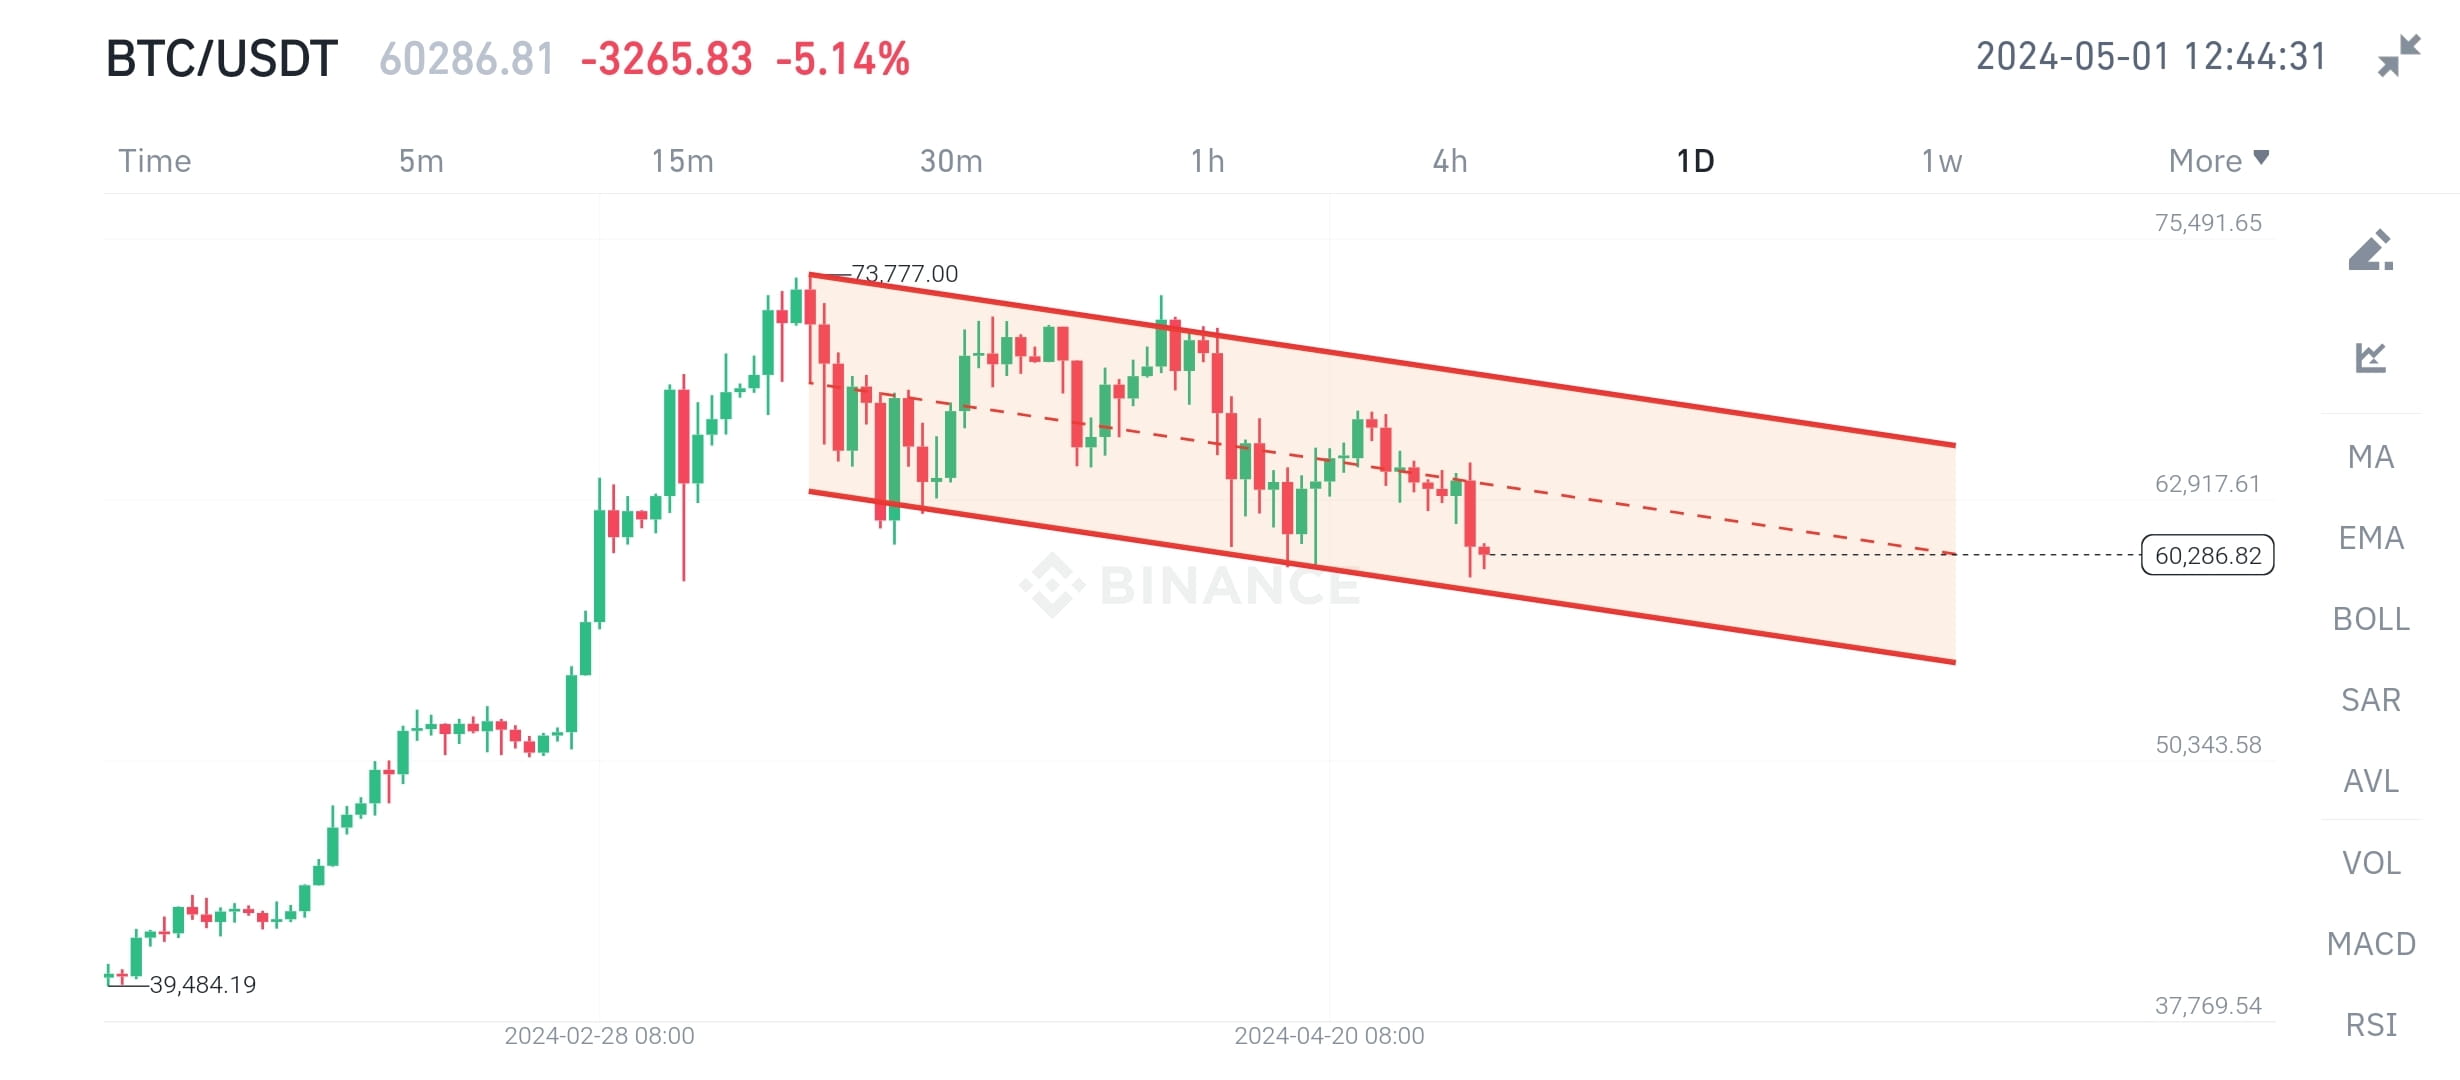
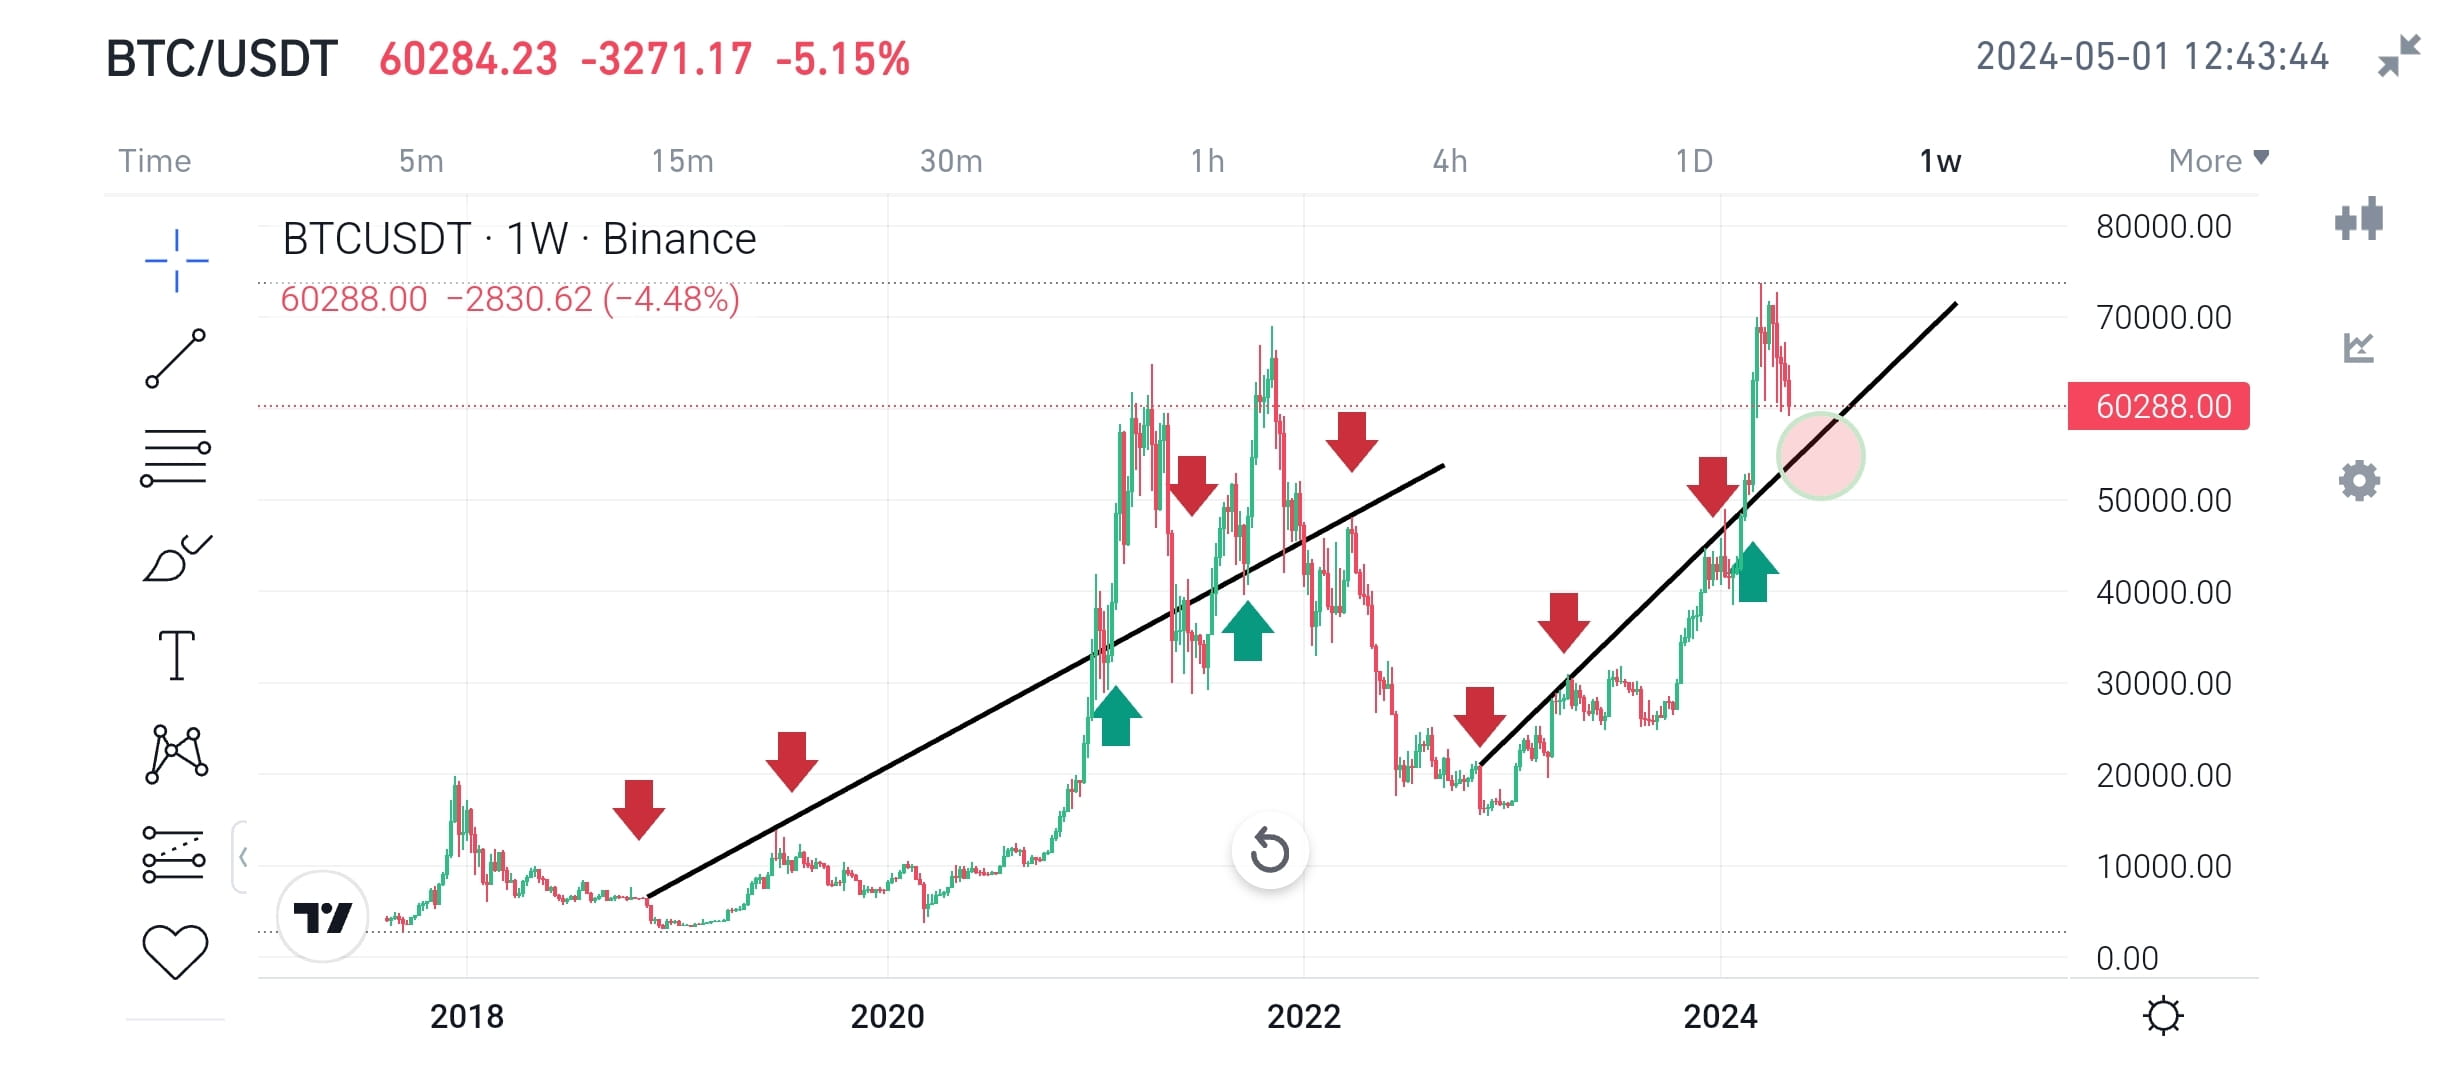
🔥🔥#BTC_MARKET_UPDATE and price movement analysis.🔥🔥
✅🔥 Figure-1 shows that $BTC is still moving in descending channel and around the bottom trendline or support line. BTC is rejected for upward movement from central trendline/resistance. Visit my previous post where you can fund details and analysis of different cases about figure-1 studied on 1D time frame(TF).
✅🔥Figure-2 represent that how the price of $BTC will act for longer term. On a weekly TF trendline drawn from the crash of 2017-18 towards the bull market movement. A similar strategy applied from the crash of 2022 towards the current bull market. In simple words, below the trendline is the bear market and above the trendline bull market. Here this trend is represented on 1W TF. Visit my profile where you can see the previous post about this case in detail.
✅🔥Yesterday #HKETF started but also a bad news for crypto community where CZ cofounder and ex-CEO of binance handed 4-months prison time. CZ always poses 4 whenever something bad happens in cryptocurrency. Also important to mention that in January when US ETFs were approved initially the market goes volatile around 48k and then drops to 37k, after that the rest is history. The same will be the case of HK ETF, you just need to show patience and keep calm rewards will come soon.
Please press follow for more information and if you like and agree with the idea. Your follow will keep me motivated to do more research and write more better content. DYOR for financial activities. This is for educational and learning purposes.
$SOL #BitcoinETFs #fomc #Fed
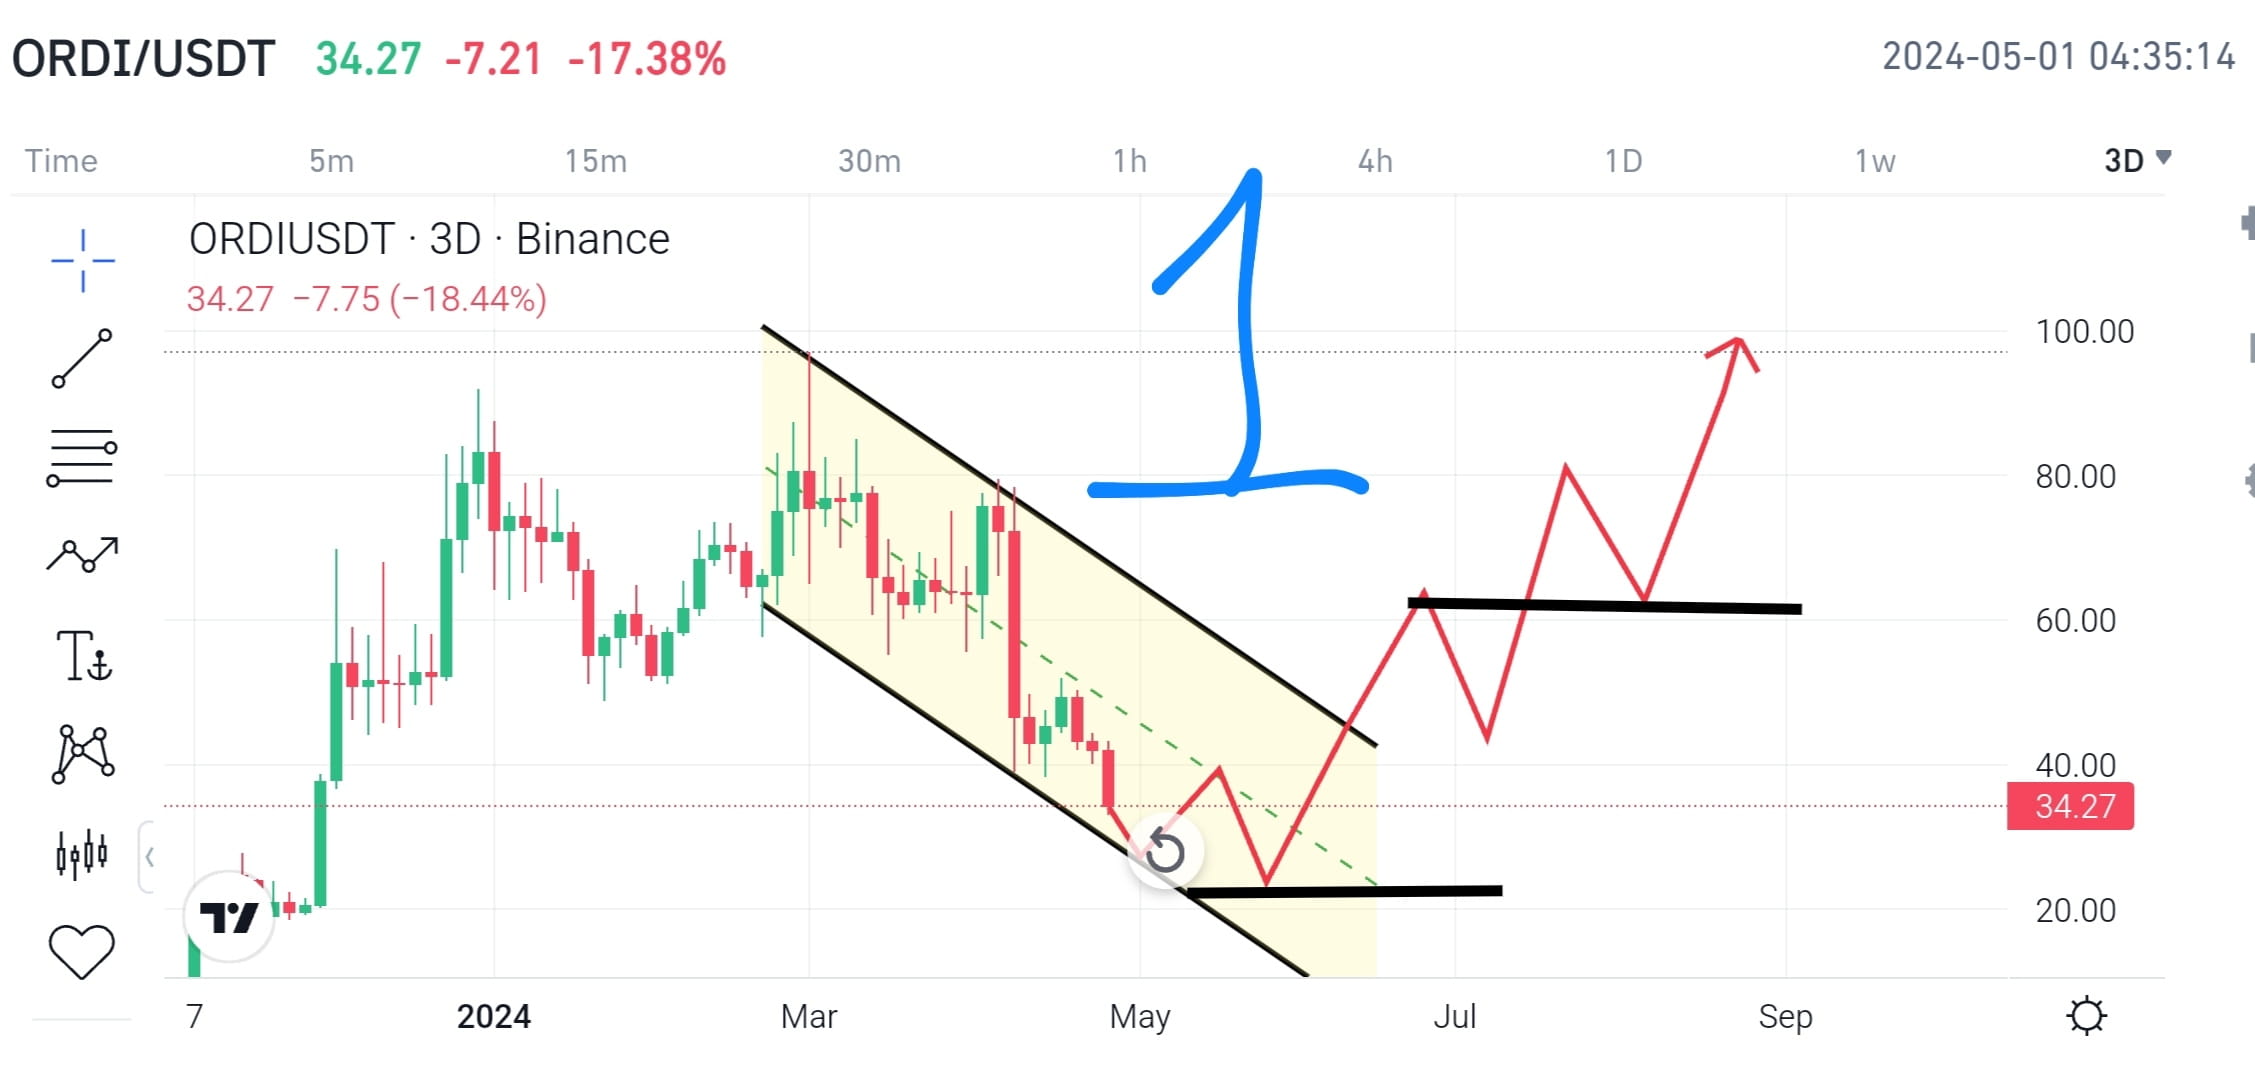
🔥🔥$ORDI price analysis from recent movement and data.🔥🔥
✅🔥 In Figure-1 chart it can be seen that $ORDI is approaching lower trendline or support of descending channel. It may be possible that it will bounce from the support and retest central trendline/resistance. If the retest fails it may cool down towards horizontal support as shown in the figure. From there it's highly likely that price goes up quickly and even breaks the upper trendline/resistance. This leads to good upward movement and ever smoothly goes towards the previous ATH during the next leg of the bull market.
✅🔥Figure-2 explains that if $ORDI took reversal from current situation then it may retest the central trendline/resistance but the bounce seems to be weak. It will probably come down and grab the liquidity sitting right around the bottom trendline/support. From there ORDI will highly probable to move upward but in case of failure it will consolidate in channel for some time. For upward price action the horizontal line is crucial for ORDI to hold. Both presented cases will be invalid in ordi fails to hold the bottom trendline of the descending channel.
✅🔥 Good times are ahead and DCA is good option/choice for those who bought at higher price. Patience means reward in this market. It is important to mention that the current market cap of ORDI is about 700m+. It performed well during the first phase of the bull market. So keep an eye on this as well. Gains will be solid.
📝📊✅After reading, please do press the follow button if you like, agree with the idea and for more important charts information. Your follow will be appreciation and motivation for me to continue. DYOR for financial activities. This is for educational and learning purposes.
#PEPE❤️ #BinanceLaunchpool #BullorBear #Megadrop #BitcoinETFs

🔥🔥$ENA price analysis from recent market data.🔥🚀
✅Figure-1 displays that ENA currently moving in a descending channel. More specifically, it is testing the central dashed trendline or resistance of channel. If it breaks this then price will move towards upward and test upper trendline but there is a high probability it may retest current resistance and if retest remains successful then price will most probably break the channel and will go in parabolic move. Those who are in the ENA trade show patience.
✅Figure-2 shows that if $ENA fails to break current resistance then if might probably test bottom trendline of channel. If ENA bounced from support then price may probably break the central resistance zone continue its upward movement. Lower or around the bottom of the channel is a good zone for spot buying and DCA, if already bought at a higher price.
✅Figure-3 depicts that there is a probability that $ENA price stay around central trendline/resistance zone for some time and when market get bullish for next leg up it will also move. From market data it seems that ENA may probably do around 5x to 7x during the next leg.
📢If any other case happens the analysis will be invalid. For good gains one needs to show patience because the market always rewards those who have patience. Those who are in those market for a long time know.
📢Please Press follow, if you agree and like the idea and want more information about other cryptocurrencies. DYOR for financial activities. All this content is for information, learning and educational purposes. Thank you.
#BinanceLaunchpool #Memecoins #Megadrop #BullorBear #BTC


📝🔥🔥🚀$FLOKI price analysis using movement in descending channel with historical data.🚀🚀🔥
🔥✅$FLOKI is moving a descending channel after hitting the local top. There are two possible actions for the price movement. These two cases are shown in figures. These different possible outcomes are based on the descending channel indicator and historical movement.
🔥✅ $floki break out fail and possible opportunity for sellers created way down to the support of the previous wave. On the support, then again possible Opportunity for buyers to gain hold on or around the trendline.
🔥✅$FLOKI break out and retest local support created in the descending channel and move in an upward direction which is a good opportunity for buyers as they need to wait for confirmation of retest before any possible upward move.
🔥✅ From market movement, market performance, social activities engagement and market cap analysis, it is highly possible that floki will do at least 10x easily during next leg up.
DYOR for financial activities. This information is for purely learning and education purposes.
Please press follow for more updates and chart extraction from the trends. Also your follow means confidence in me to continue to do research.
#FlokiRoadmap2024 #Memecoins #BTC #BullorBear #Megadrop


🚀💹💰 Top Altcoins Ready to Explode After Bitcoin's Halving 🚀💹💰
📢 #Memecoins🤑🤑 (Research Based on market sentiments)
1: $PEPE - 10x to 20x
2: $WIF - 10x to 15x
3: $BONK - 10x-15x
4: $Doge - 4x to 6x
5: $SHIB - 3x to 5x
6: $BOB - 15x to 25x
7: $NPC - 15x to 25x
8: $FLOKI -10x to 15x
9: $POPCAT - 20x to 30x
📢Layer 1
1: $TAO - 5x to 8x
2:$NEAR - 9x to 12x
3:$SOL- 5x to 6x
4:$ADA - 5x max
5:$INJ - 8x to 12x
6:$ATOM - 8x to 10x
7:$SEI - 13x to 16x
8:$SUI - 13x to 16x
📢 Layer 2
1: $ARB - 7x to 10x
2: $IMX - 12x to 15x
3: $METIS - 10x to 15x
4: $MATIC - 5x to 7x
5: $OP - 8x to 11x
6: $MANTA - 10x to 15x
📢 Defi
1: $RUNE - 5x to 8x
2: $ROSE - 5x to 8x
3: $JUP - 7x to 10x
4: $LINK - 5x to 7x
6: $UNI - 6x to 8x
7: $GRT - 5x to 10x
8: $AAVE - 12x to 15x
9: $WOO - 10x to 13x
10:$MKR - 5x to 7x
📢 AI
1: $TAO - 5x to 7x
2: $AKT - 20x to 25x
3: $FET- 15x to 20x
4: $RNDR - 8x to 12x
5: $OCEAN - 15x to 20x
6: $AGIX - 18x to 25x
7: $PAAL - 5x-10x
After doing research and reading white paper(Layers, Defi and AI) prepare the above list, and if I missed your favourite one write it in comment.
Please press follow for more updates and information. You follow is appreciation and motivation for me to continue doing research. DYOR for financial activities this is for learning purposes. Thank you
#PEPE❤️ #BTC #ScamRiskWarning #Shibalnu

🔥💰🔥$PEPE quick price movement from different indicators.💰🔥💰
✅🔥Testing descending channel upper trendline(resistance), if break then boom boom.
✅🔥MA(7) yesterday's support
✅🔥EMA(7) today's bounce
✅🔥Volume decreases MA(5) and MA(10) crossed today.
✅🔥Bollinger Band: currently moving between MB and UB.
✅🔥MACD on daily time frame is bullish.
RSI(6) is bullish.
✅🔥StochRSI is bullish l. Last time it did 13x from same StochRSI.
✅10-15x very high probability.
Press follow for more information and updates, if you like the current analysis. DYOR for financial activities. These are for learning purposes.
#Memecoins #pepeisonmymind #PepeToRunTheBull #PEPE❤️ #BTC $BTC $BONK

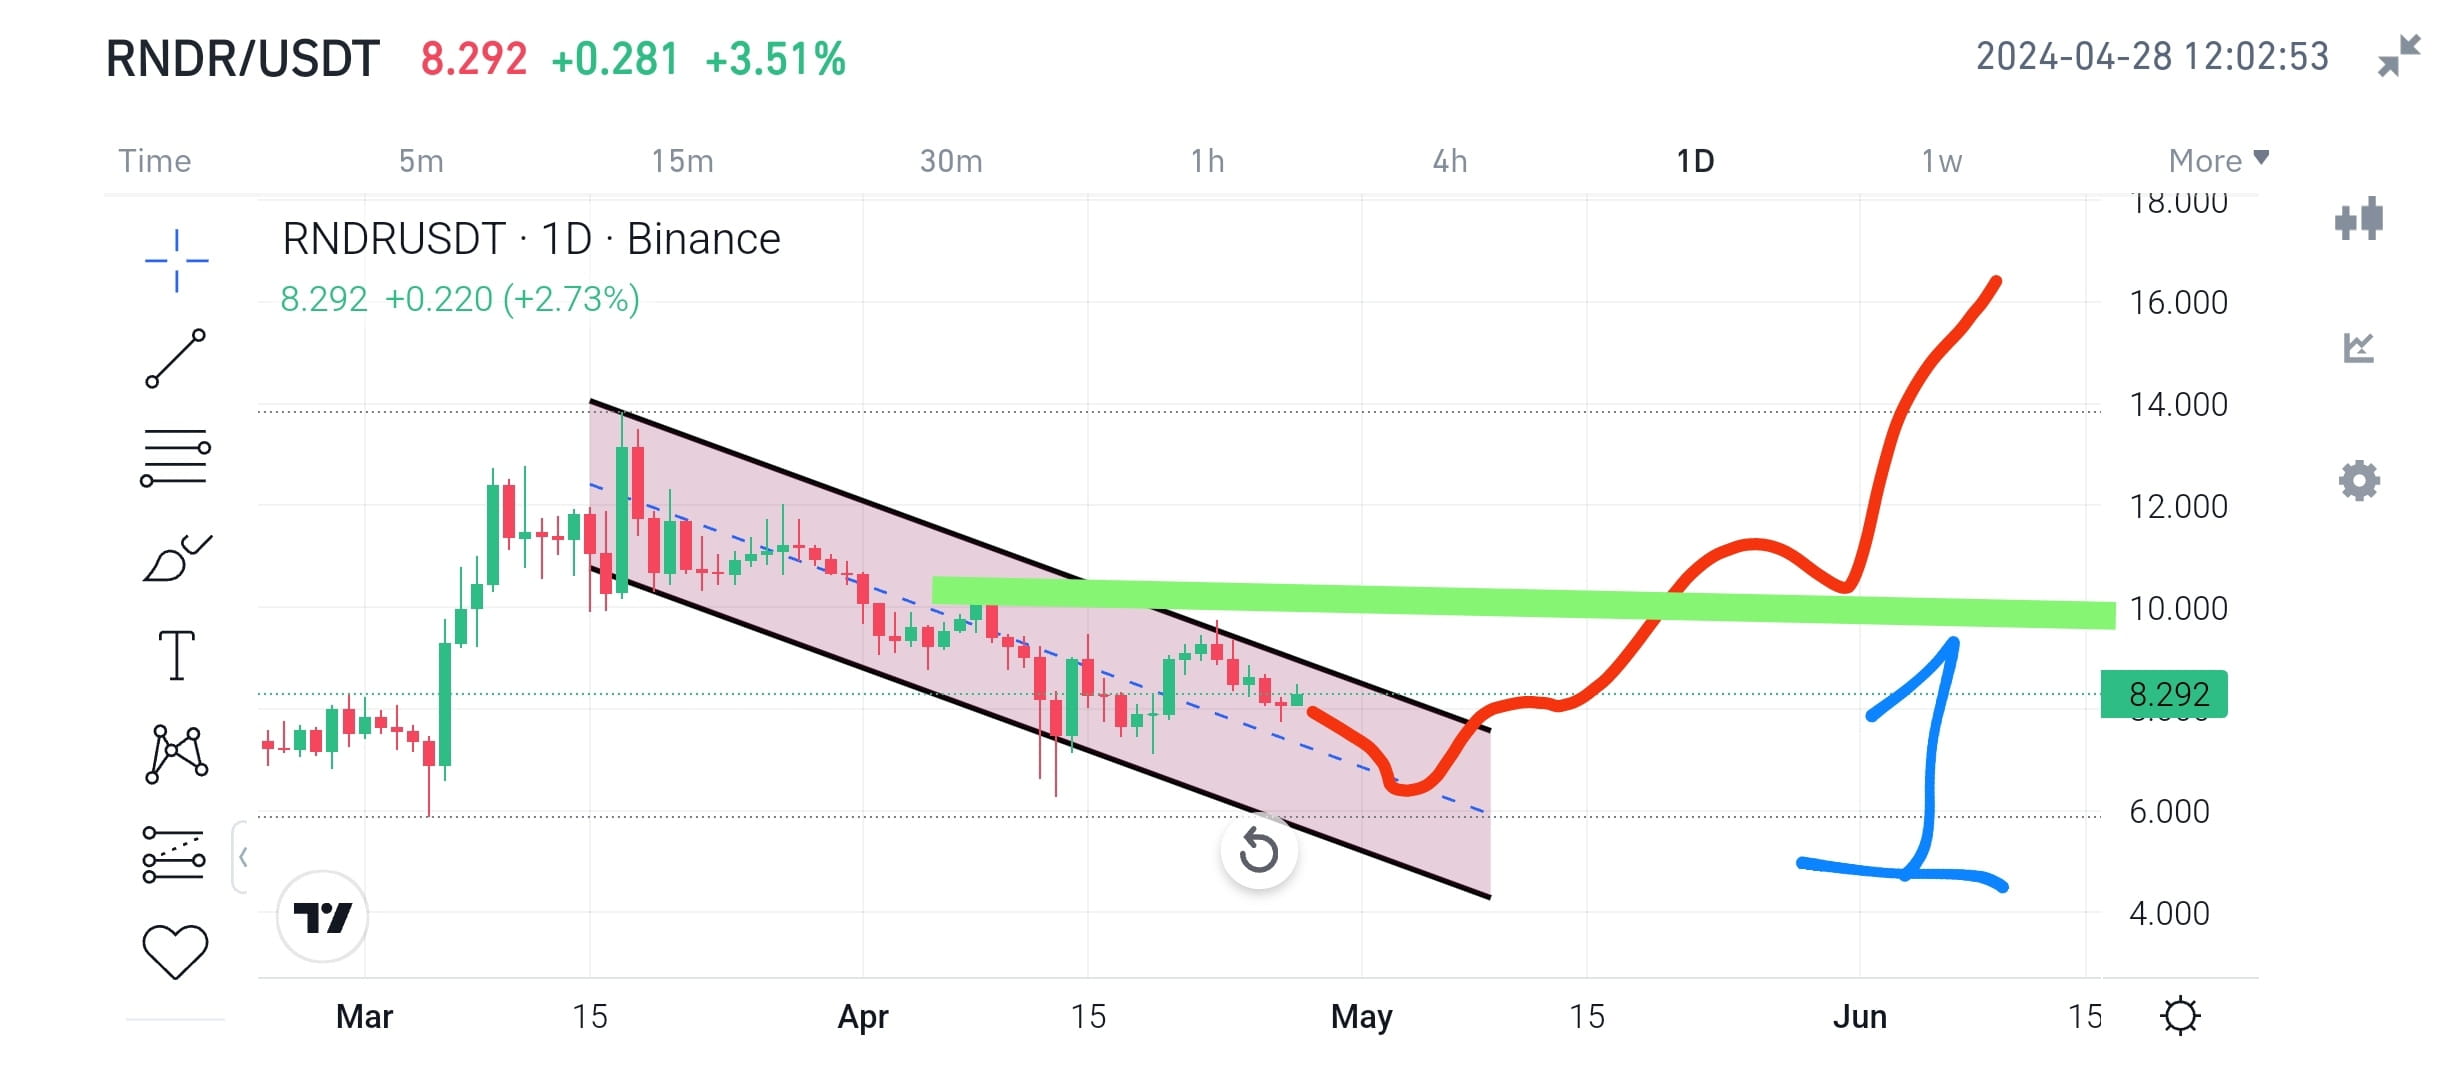
🔥🔥🚀$RNDR price analysis under current market data. 🚀
✅🔥 Figure-1 display that #RNDR/USDT💥 is consolidating between central and upper part of channel i-e., one acting as a support(central trendline) and other as a resistance(upper trendline) of descending channel. It may be possible that it retests the support zone a few more times from where it is highly likely prices may bounce and after which the price will possibly continue to move upward with a range of $15-16. RNDR is showing good movement and already up 50-70% from the recent dump.
✅🔥 Figure-2 chart displays that if Render fails to break resistance of descending channel then the price may dump hard and probably touch the bottom of the channel but and it is possible $RNDR will rebound from lower support of the channel. Bounce from support will be a strong like last move and it continue to move upward and possibly may break the upper resistance of the descending channel. This is a quite strong case for upward movement and future price direction
✅🔥 Spot buyers, if they bought at higher price then wait for $RNDR to come around the lower zone of the descending channel and then can do DCA and HODL for good reward. An observation from price performance, recent activities and market cap makes the case for possible will do 5-7x during the next leg of the bull market. Therefore stay calm and understand the recent situation of the market. AI coins are the leader of the bull run this season.
📝PLEASE PRESS FOLLOW if you like and agree with the idea and want more information about other crypto currencies. DYOR for financial activities. This information is only for learning and education purposes. Thank you.
#BTC #Memecoins #BullorBear #Alert!!

🔥🚀$btc price analysis from recent market data.🔥🚀
✅🔥 $BTC has stayed strong despite lots of bad news. It's sitting at around $63,200, which is impressive considering everything going on. In the past, when Bitcoin's price stayed the same for a while, it usually shot up afterward.
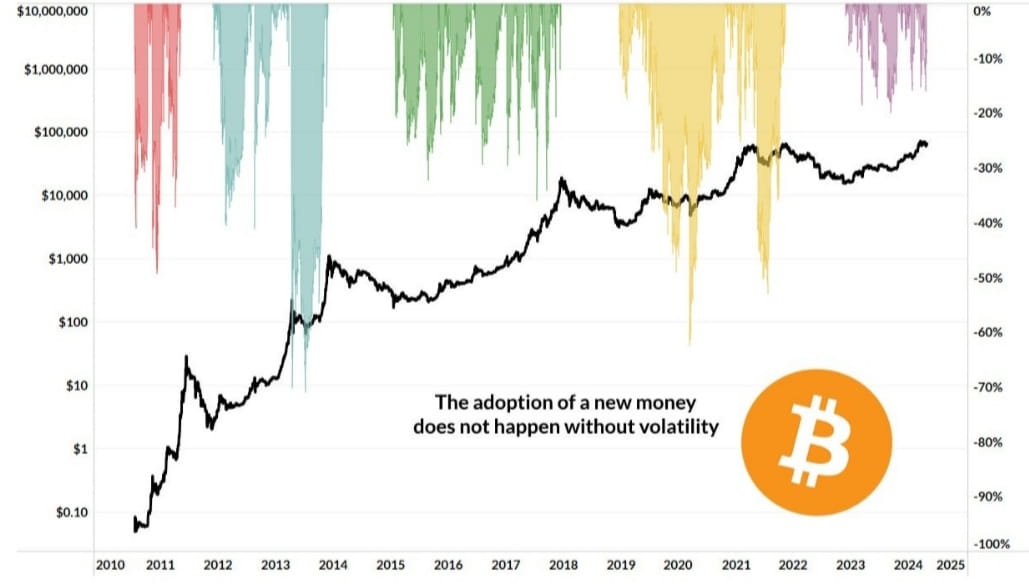
✅🔥$BTC currently sitting around 12-14% below its all-time high, which is a typical occurrence during bull markets. This underscores the volatility inherent in the transition to a new monetary system.
✅🔥 When BTC reached its old peak, some of these long-held coins started moving, likely to be sold. But now, that movement has stopped. About 65% of Bitcoin hasn't moved in a year or more, indicating that those who wanted to sell at current prices have likely already done so. This suggests that the next price increase might not be far off.
✅🔥The halving, which occurs every four years and cuts the bitcoin block subsidy in half, sparked a surge in on-chain demand. Despite the subsidy dropping from 6.25 to 3.125 BTC, daily mining revenue hit new all-time highs thanks to increased transaction fees. With only about 450 BTC mined per day now, compared to around 900 before, the constant selling pressure from miners to cover expenses has been halved.
📝Please Press follow for more updates and information. Your follow is motivation for me. DYOR for financial activities. This is for learning and education purposes. Thank you.
#Megadrop #BTC $ETH #Memecoins #marketalart #BinanceLaunchpool
✅🔥 $BTC has stayed strong despite lots of bad news. It's sitting at around $63,200, which is impressive considering everything going on. In the past, when Bitcoin's price stayed the same for a while, it usually shot up afterward.
✅🔥$BTC currently sitting around 12-14% below its all-time high, which is a typical occurrence during bull markets. This underscores the volatility inherent in the transition to a new monetary system.
✅🔥 When BTC reached its old peak, some of these long-held coins started moving, likely to be sold. But now, that movement has stopped. About 65% of Bitcoin hasn't moved in a year or more, indicating that those who wanted to sell at current prices have likely already done so. This suggests that the next price increase might not be far off.
✅🔥The halving, which occurs every four years and cuts the bitcoin block subsidy in half, sparked a surge in on-chain demand. Despite the subsidy dropping from 6.25 to 3.125 BTC, daily mining revenue hit new all-time highs thanks to increased transaction fees. With only about 450 BTC mined per day now, compared to around 900 before, the constant selling pressure from miners to cover expenses has been halved.
📝Please Press follow for more updates and information. Your follow is motivation for me. DYOR for financial activities. This is for learning and education purposes. Thank you.
#Megadrop #BTC $ETH #Memecoins #marketalart #BinanceLaunchpool


Explore Content For You
Sign up now for a chance to earn 100 USDT in rewards!
or
Sign up as an entity
or
Log In


