
SUI's pre-launch form is textbook-like. Whether the copycat has been launched can also be compared with the SUI case. At the end of the article, some good copycat targets seen in the current market scan will be listed. It will be updated continuously in the next two days. Please forward and bookmark it.
Let’s first look at SUI’s review:
On August 14, a friend in the group asked me about the volume and price status of SUI and where to intervene. At that time, the shape of SUI was indeed good-looking. After the panic selling at the bottom, it pulled up with volume. The average trading volume during this period was a historical high. This is the behavior of the main force. However, we know that the change in the characteristics of the downward trend must require two conditions:
1. Volume-driven upward wave
2. Shrinking volume retracement wave/retracement wave of strong demand
Only when these two conditions are met, can it be clear that the main force has the intention to follow a trend. Then this retracement must maintain a high bottom state. The position seen at that time was 0.57-0.75. In the following month, it retraced to 0.75, which is the best position to get on board.

The trend of the retracement:

After the pullback, the volume and price here are textbook-like. Everything is marked on the picture. You can click on the picture to see the details.
A key point here is easily misunderstood, that is, when the price falls back to the support, the volume is also large. If you just look at the volume, many people will think that the selling pressure here is still very large, but looking at the local bottom, although the decline is large, it has little impact on the K-line price. Simply put, the efforts of the selling pressure here have no results, that is, demand has been strongly absorbing supply.
Pick-up point 4 hours after the breakout:
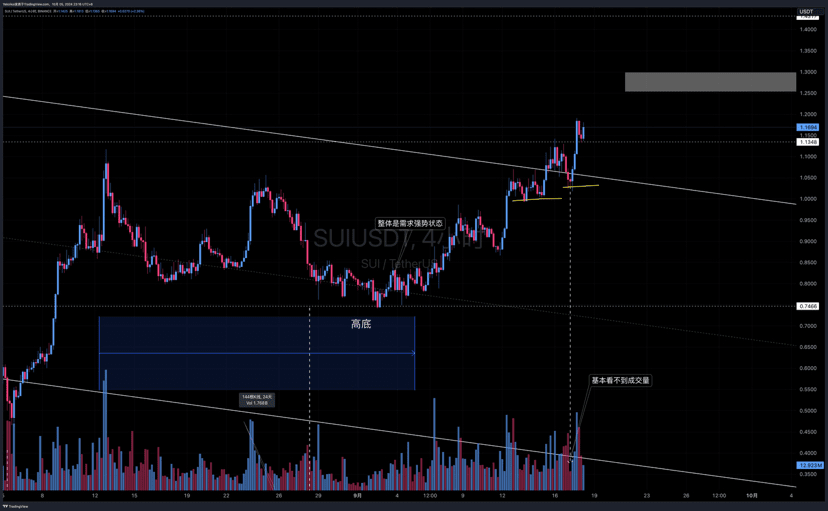 When making plans on August 14, there were two entry points. The first was a pullback to around 0.75, and the second was a break through the upper boundary of the daily down channel. Here you can find a retracement point through the 4-hour level. There is basically no selling pressure at the pullback here, and it is still at a high bottom. This is also the best entry point.
SUI's volume and price pattern is simply textbook, so this time many copycats also have signs of starting up. Today's rough scan shows:
Retracing to the bottom of accumulation High support:
MEME:
TREES
SATS
ORDI
MEME
DOGE
Public chain:
INJ
SUN
ETH
DYM (DYM time is not enough)
ON
Break through the falling channel and step back to the channel:
WIF
RATS
BABY
BONK
SHIB
The above is just a rough overview, and I have not read the market carefully. You can add tags and leave comments. We will streamline it later. The closer the volume and price trends of the copycat are to SUI and the textbook, the greater the probability of subsequent pull-ups.
#SUI#PEPE#ORDI#BTC#ETH #SOL
☺️☺️☺️


