Neo Trader
@Austin1999
仅作为个人思考和记录,而非投资建议。如果内容相似,可能是因为受到同个老师的指导或启发。
Следвани
Последователи
Харесано
Споделено
PINNED
Right now, focus on updating intraday support and resistance levels for Bitcoin (BTC) and Ethereum (ETH).$BTC $ETH
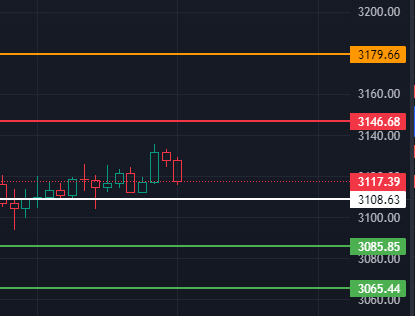
Ethereum fell below the white line, and the 4-hour level is preparing for a correction. Pay attention to the bottom support of 3085 in the sideways area. If it falls below 3085, the 1/2-hour level will turn bearish.
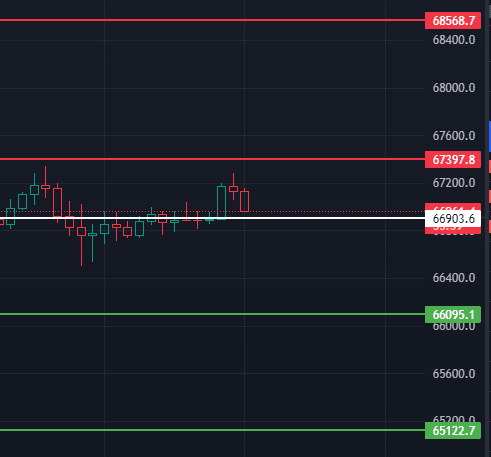
The Bitcoin point is still valid. If it falls below 66900, the correction will only start in 4 hours.
$BTC $ETH
The Bitcoin point is still valid. If it falls below 66900, the correction will only start in 4 hours.
$BTC $ETH

Neo Trader
--
BTC/ETH intraday market analysis on May 19, 2024:
### Bitcoin (BTC)
- **Current Support and Resistance Levels**
- **Support Levels**: 66100, 65120, 63860
- **Resistance Levels**: 66900, 67400, 68570, 70075, 71620
- **Trading Recommendations**
- If Bitcoin falls below 66900, it may start a 1/2/4-hour correction. Pay attention to the support levels at 66100, 65120, and 63860.
- If the price does not fall below 66665 and fails to break through 67400, it is expected to continue consolidating sideways on the 4-hour chart. In this case, wait for further signals.
- If it breaks through 67400, the upper targets and resistance levels are 68570, 70075, and 71620.
### Ethereum (ETH)
- **Current Support and Resistance Levels**
- **Support Levels**: 3085, 3065, 3017
- **Resistance Levels**: 3108, 3146, 3180, 3220
- **Trading Recommendations**
- If Ethereum falls below 3108, it may start a 1/2/4-hour correction. Pay attention to the support levels at 3085, 3065, and 3017.
- If the price does not fall below 3085 and fails to break through 3146, it is expected to continue consolidating sideways on the 4-hour chart. In this case, wait for further signals.
- If it breaks through 3146, the upper targets and resistance levels are 3180, 3220.$BTC $ETH
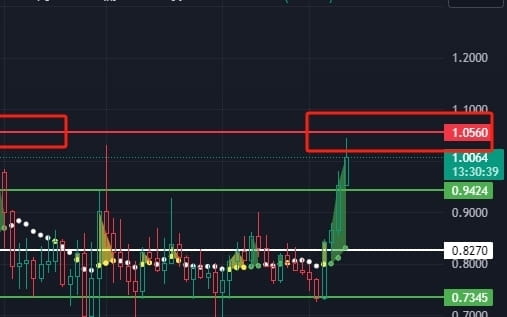
"$Ondo" has risen to near the previous high pressure level. You need to pay attention to this pressure level. If it breaks through strongly, it will continue to rise; if it cannot break through, it should reduce its position.
BTC/ETH intraday market analysis on May 18, 2024:
The Bitcoin's significant support today is at 66660, which is the bottom support of the horizontal trading zone. If Bitcoin falls below this level, a two-hour correction could begin, with the following key supports at 66186 and 65120. However, as long as Bitcoin's price remains above 66660, theres's the possibility that it will continue to rise, with the targets at 67400, 68570, and 70360.
For Ethereum, it has shown strength in recent days and is currently pushing against the rebound's resistance range. It's crucial to watch out for 3091 today, as long as it doesn't drop below this mark, the market might continue to rise. The resistance levels are around 3135, 3180, 3220. If it falls below the support at 3091, we could potentially see a one-hour level retracement with key supports at 3074, 3022, and 2980.


BTC/ETH intraday market analysis on May 17, 2024:
For Bitcoin, 65700 is the key 4-hour support level. If the price does not fall below 65700, the market at the 1-hour and 2-hour levels is expected to continue to rise, with the upper target and pressure level being between 66500 and 67200 respectively. However, if the price falls below 65700, the 4-hour level will begin to pull back, with the lower support levels at 64675, 63860, and 62780.
As for Ethereum, during the current rebound at the 1-hour level, the upper pressure is around 2960, 2983 and 3005. If the price cannot break through these pressure levels, the market may continue to fall, with the lower support levels being 2940, 2895 and 2864.$BTC $ETH


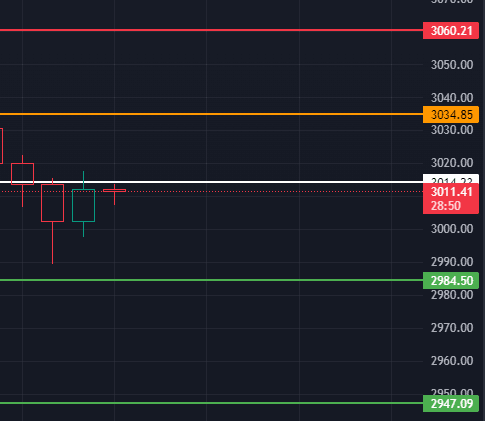
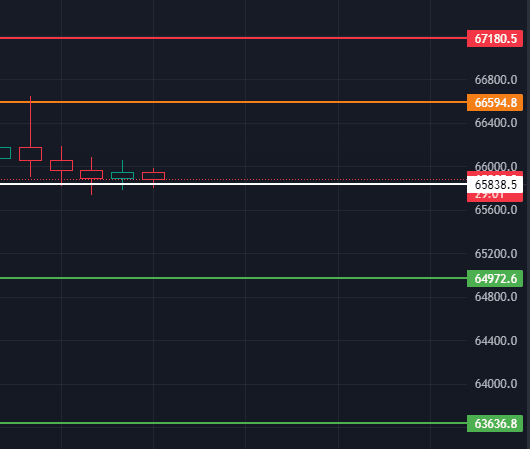
For Bitcoin, if it fails to break below a specific level (the white line) during a pullback, it may continue to rise; otherwise, it might consolidate near the green support level below. As for Ethereum, if it breaches the corresponding level (the white line), it could initiate a pullback, with support located around the lower green line.


Neo Trader
--
BTC/ETH intraday market analysis on May 16, 2024:
The Bitcoin trend is upward, but there might be a daytime pullback, suggesting buying during the dip. Both Bitcoin and Ethereum have reached resistance levels, so consider reducing positions to secure profits if you're already in, and if not, wait patiently. If Bitcoin falls below 65840, it could indicate a pullback, but if it holds above, the uptrend may continue. Keep an eye on 3015 for Ethereum today; breaking below could lead to a pullback, while holding above suggests further upward movement.$BTC $ETH #美国4月CPI数据回落 #BTC走势分析 #ETH走势分析
The Bitcoin trend is upward, but there might be a daytime pullback, suggesting buying during the dip. Both Bitcoin and Ethereum have reached resistance levels, so consider reducing positions to secure profits if you're already in, and if not, wait patiently. If Bitcoin falls below 65840, it could indicate a pullback, but if it holds above, the uptrend may continue. Keep an eye on 3015 for Ethereum today; breaking below could lead to a pullback, while holding above suggests further upward movement.$BTC $ETH #美国4月CPI数据回落 #BTC走势分析 #ETH走势分析
This month's market is unstable. If Bitcoin can't break 67600, it'll likely keep fluctuating, making profits hard to find. But if it surpasses 67600 and hits 68000, the market might reverse, boosting prices for other cryptocurrencies like Ethereum.
#美国4月CPI数据回落 #BTC走势分析 #BTC预测
#美国4月CPI数据回落 #BTC走势分析 #BTC预测
On the 4-hour chart, pay attention to the position of the white line during pullbacks, as the resistance level of the orange line is very strong.
$BTC $ETH
$BTC $ETH


Neo Trader
--
BTC/ETH intraday market analysis on May 15, 2024:
For Bitcoin, it's currently trading sideways on the 4-hour timeframe with a bounce observed on the 1/2-hour chart. Pay attention to the key level at 61650. As long as it holds above this level today, the 1/2-hour timeframe is likely to remain bullish. Resistance levels to watch are around 62190, 62740, and 63150. A close below 61650 on the 1/2-hour chart today could indicate a failed bounce and a potential shift to a bearish trend. Support levels are near 61380, 61100, and 60750.
For Ethereum, it's also trading sideways on the 4-hour timeframe with a bounce observed on the 1/2-hour chart. Pay attention to the key level at 2888. As long as it holds above this level today, the 1/2-hour timeframe is likely to remain bullish. Resistance levels to watch are around 2920, 2949, and 2973. A close below 2888 on the 1/2-hour chart today could indicate a failed bounce and a potential shift to a bearish trend. Support levels are near 2862, 2815, and 2768.
$BTC $ETH
Market Expectations and Analysis Ahead of the Release of US April CPI Data
Tonight at 20:30, the much-anticipated US April seasonally adjusted CPI annual rate is set to be released, which could determine the market's medium-term to short-term trajectory. However, the conventional logic suggests a lack of optimism, as the performance of key components such as energy prices, rent, and used cars in April was not particularly promising, indicating that the CPI as a composite index may not be very optimistic either.
Looking back at the market performance after the last data releases, some trends can be observed:
On April 10th, the expected value for the US March seasonally adjusted CPI annual rate was 3.4%, but the actual announced value was 3.5%, leading to a market decline. On April 26th, the expected value for the US March core PCE price index annual rate was 2.7%, but the actual announced value was 2.8%, resulting in a similar decline in the market.On May 3rd, the expected US April unemployment rate was 3.8%, but the actual announced value was 3.9%, with non-farm employment significantly lower than expected, leading to a sharp market rise.On May 9th, the initial jobless claims for the week were expected to be 215,000, but the actual announced value was 231,000, resulting in an increase in the market.On May 11th, the expected value for the US May one-year inflation rate was 3.2%, but the actual announced value was 3.5%, leading to another market decline.On May 14th, the expected value for the US April PPI month-on-month rate was 0.3%, but the actual announced value was 0.5%, resulting in another market decline.
Therefore, when the data is released tonight, the following logical judgments can be considered:
If the announced value is higher than the previous value of 3.5%, it may lead to a market decline.If the announced value is lower than the previous value but higher than the expected value of 3.4%, it may also trigger a market decline.If the announced value is consistent with expectations but lower than the previous value of 3.4%, the market may rise.If the announced value is lower than both the expected and previous values of 3.3%, it may also lead to a market rise.
Personally, I believe the announced value may be equal to or slightly biased towards 3.4%, as Federal Reserve Chairman Powell has taken multiple measures to manage expectations. However, overly outstanding data may not be conducive to an immediate interest rate cut, which may not align with the overall trend. Nevertheless, given the current market volatility and eagerness for an immediate rate cut, the market is indeed difficult to predict, and I do not recommend speculation. It's best to observe and exit if you're uncertain.
BTC/ETH intraday market analysis on May 15, 2024:
For Bitcoin, it's currently trading sideways on the 4-hour timeframe with a bounce observed on the 1/2-hour chart. Pay attention to the key level at 61650. As long as it holds above this level today, the 1/2-hour timeframe is likely to remain bullish. Resistance levels to watch are around 62190, 62740, and 63150. A close below 61650 on the 1/2-hour chart today could indicate a failed bounce and a potential shift to a bearish trend. Support levels are near 61380, 61100, and 60750.
For Ethereum, it's also trading sideways on the 4-hour timeframe with a bounce observed on the 1/2-hour chart. Pay attention to the key level at 2888. As long as it holds above this level today, the 1/2-hour timeframe is likely to remain bullish. Resistance levels to watch are around 2920, 2949, and 2973. A close below 2888 on the 1/2-hour chart today could indicate a failed bounce and a potential shift to a bearish trend. Support levels are near 2862, 2815, and 2768.
$BTC $ETH
For Bitcoin, it's currently trading sideways on the 4-hour timeframe with a bounce observed on the 1/2-hour chart. Pay attention to the key level at 61650. As long as it holds above this level today, the 1/2-hour timeframe is likely to remain bullish. Resistance levels to watch are around 62190, 62740, and 63150. A close below 61650 on the 1/2-hour chart today could indicate a failed bounce and a potential shift to a bearish trend. Support levels are near 61380, 61100, and 60750.
For Ethereum, it's also trading sideways on the 4-hour timeframe with a bounce observed on the 1/2-hour chart. Pay attention to the key level at 2888. As long as it holds above this level today, the 1/2-hour timeframe is likely to remain bullish. Resistance levels to watch are around 2920, 2949, and 2973. A close below 2888 on the 1/2-hour chart today could indicate a failed bounce and a potential shift to a bearish trend. Support levels are near 2862, 2815, and 2768.
$BTC $ETH


BTC/ETH intraday market analysis on May 14, 2024:
For Bitcoin (BTC) today, the crucial level to watch is $62,200, which serves as support on the 1/2-hour timeframe and indicates bullish sentiment on the 4-hour and daily charts. Holding above $62,200 suggests potential long positions, with resistance levels at approximately $62,815, $63,155, and $63,440. However, breaching $62,200 could signal the end of the current uptrend, transitioning to a bearish stance on shorter timeframes and initiating a retracement towards support levels near $61,710, $61,145, and $60,750.
As for Ethereum (ETH), attention should be focused on the $2,938 level today. Failure to sustain above this level may mark the end of the current upward movement on the 4-hour chart, with support levels around $2,896, $2,865, and $2,815. Conversely, if $2,938 holds, a probable short-term rebound is likely, with resistance levels near $2,955, $2,973, and $2,997.
$BTC $ETH


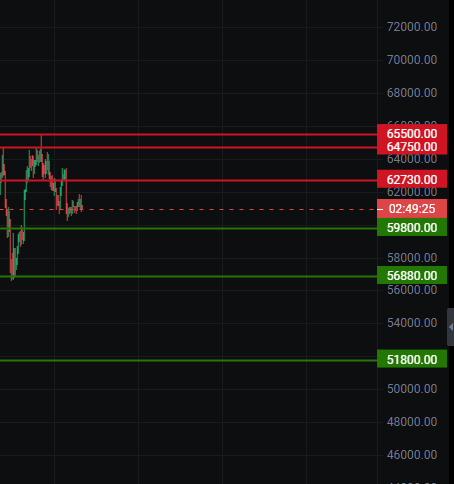
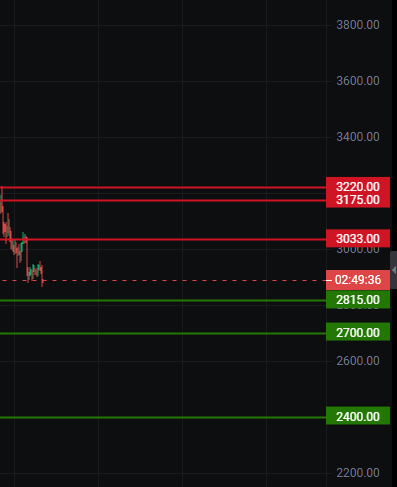
BTC/ETH weekly chart support and pressure:
For Bitcoin (BTC) on the weekly level, the rebound resistance levels are: 62730, 64750, and 65500. Support levels are: 59800, 56880, and 51800.
For Ethereum (ETH) on the weekly level, the rebound resistance levels are: 3033, 3175, and 3220. Support levels are: 2815, 2700, and 2400.
$BTC $ETH
For Bitcoin (BTC) on the weekly level, the rebound resistance levels are: 62730, 64750, and 65500. Support levels are: 59800, 56880, and 51800.
For Ethereum (ETH) on the weekly level, the rebound resistance levels are: 3033, 3175, and 3220. Support levels are: 2815, 2700, and 2400.
$BTC $ETH
BTC/ETH intraday market analysis on May 13, 2024:
For BTC, attention is on the 61250 level today. If it holds above this level on the 1/2-hourly chart closing, there's a high probability of an upward surge, with targets/resistance levels around 61760, 62250, and 63190. If the rebound fails to hold above 61250, it indicates a weak downward trend, with support levels around 60540, 60100, and 59580.
As for ETH, focus is on the 2920 level today. If it holds above this level on the 1/2-hourly chart closing, there's a high probability of an upward surge, with targets/resistance levels around 2946, 2973, and 3005. If the rebound fails to hold above 2920, it indicates a weak downward trend, with support levels around 2863, 2815, and 2768.
$BTC $ETH


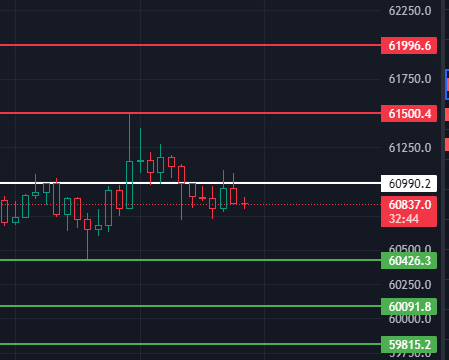
BTC/ETH intraday market analysis on May 12, 2024:
Today, it is expected that the market will continue to fluctuate in the 4-hour sideways zone during the day. If you want to get out of the market, pay attention to the top pressure level or the bottom support level of the sideways zone.
The market's 4-hour sideways shock range is 60430-61500. For small levels, pay attention to the 60990 position. If it falls below and cannot close, the market will start to decline. For the lower target/support level, pay attention to the bottom support of the 60400 sideways area. If it cannot hold up, it will continue to fall. Look around the locations 60100-59810.
If the closing line stands firmly above 60990, the 1/2 hour level will begin to rebound, and the upper target/pressure level will be around 61500-62000.
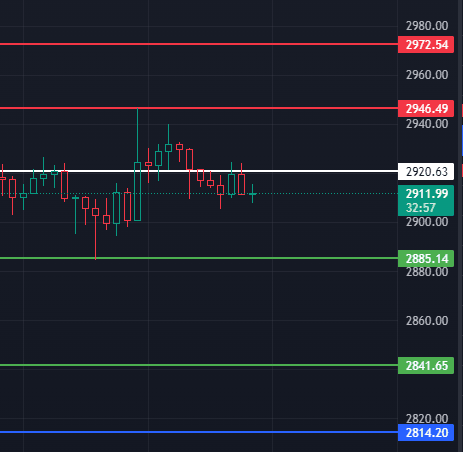
Ether's 4-hour sideways fluctuation range is 2885-2945. For small levels, pay attention to the 2920 position. If it falls below and cannot close, the market will start to decline. For the lower target/support level, pay attention to the bottom support of the 2885 sideways area. If it cannot hold up, continue to look down. 2841-2815-2790 are nearby these locations.
If the closing line stands firmly above the 2920 position, the 1/2 hour level will begin to rebound, and the upper target/pressure level will be around the 2945-2973-3015 positions.
$BTC $ETH
Today, it is expected that the market will continue to fluctuate in the 4-hour sideways zone during the day. If you want to get out of the market, pay attention to the top pressure level or the bottom support level of the sideways zone.
The market's 4-hour sideways shock range is 60430-61500. For small levels, pay attention to the 60990 position. If it falls below and cannot close, the market will start to decline. For the lower target/support level, pay attention to the bottom support of the 60400 sideways area. If it cannot hold up, it will continue to fall. Look around the locations 60100-59810.
If the closing line stands firmly above 60990, the 1/2 hour level will begin to rebound, and the upper target/pressure level will be around 61500-62000.
Ether's 4-hour sideways fluctuation range is 2885-2945. For small levels, pay attention to the 2920 position. If it falls below and cannot close, the market will start to decline. For the lower target/support level, pay attention to the bottom support of the 2885 sideways area. If it cannot hold up, continue to look down. 2841-2815-2790 are nearby these locations.
If the closing line stands firmly above the 2920 position, the 1/2 hour level will begin to rebound, and the upper target/pressure level will be around the 2945-2973-3015 positions.
$BTC $ETH
BTC/ETH intraday market analysis on May 11, 2024:
**BTC:
- Currently, BTC is in a bearish market across all levels. Today's focus is on 60700; if the price holds steady at this level, a rebound on the 1-hour timeframe may occur.
- Key resistance levels above include 61350, 61900, and 64050, which need close attention. Especially if the price stabilizes at 61900, it indicates a potential rebound on the 4-hour timeframe.
- Conversely, if today's rebound lacks strength and breaks below 60700, it suggests a weak rebound. In this case, we can first look to yesterday's low as support, then observe support levels near 59800, 58670, and 57630.
**ETH:
- ETH is currently also in a bearish market. Today's main focus is on 2905; if the price holds steady, a rebound on the 1-hour timeframe may occur.
- Key resistance levels above include 2940, 2975, and 3020, which require particular attention. Especially if the price holds steady at 2974, it may indicate the start of a rebound on the 4-hour timeframe.
- Conversely, if today's rebound lacks strength and breaks below 2905, it may signal a weak rebound. In this case, we can first look to yesterday's low as support, then observe support levels near 2870, 2820, and 2770.$BTC $ETH


Currently updated on the 4-hour timeframe:
Bitcoin is currently showing strong bullish momentum, maintaining an upward trend over the past 1/2/4 hours. Next, if the price retraces without breaking below the range of 62540-62120, it could be a good opportunity to go long, with resistance above at the level marked by the red line.
Ethereum is also displaying bullish strength. If it manages to firmly break above 3055, it might trigger a rebound on the 4-hour timeframe, potentially leading to an uptrend on the daily chart. Next, if the price retraces without dropping below 3020-3005, it could present a buying opportunity, with resistance above still at the level marked by the red line.$BTC $ETH


Neo Trader
--
BTC/ETH intraday market analysis on May 10, 2024:
For Bitcoin today, the focus remains on the $62,000 level, which serves as a key support/resistance zone on both the 4-hour and daily charts. If the price retraces but holds above this level, the market is likely to remain bullish, with a high probability of further upward oscillation. Key resistance levels to watch above are around $63,440, $64,400, and $65,360. However, if the price retraces and falls below $62,000 today, it would signal the potential end of the current 4-hour rebound, with support levels to watch below around $60,950, $59,800, and $58,670.
As for Ethereum, attention is on the $3,000 level today, which is a crucial support/resistance zone on the 4-hour chart. If the price retraces but holds above this level, the market is likely to remain bullish, with a high probability of further upward oscillation. Key resistance levels to watch above are around $3,055, $3,095, and $3,135. However, if the price retraces and falls below $3,000 today, it would signal the potential end of the current 4-hour rebound, with support levels to watch below around $2,955, $2,915, and $2,870.
$BTC $ETH


Evening trading strategy:
For Bitcoin:
- Bitcoin is showing signs of upward movement on the 1/2-hour timeframe and starting to rebound on the 4-hour timeframe.
- In the early hours, attention was paid to the 61900 level for Bitcoin. If this level holds, a rebound trend on the 4-hour timeframe will be initiated. Keep an eye on resistance levels near 62900, 63750, and 64500.
- If Bitcoin falls below 62000 in the evening, the current rebound will end, and the 4-hour timeframe will continue to oscillate sideways. Watch out for support levels near 60900, 59800, and 58670.
For Ethereum:
- Ethereum is showing signs of upward movement on the 1/2-hour timeframe and starting to rebound on the 4-hour timeframe.
- In the early hours, attention was paid to the 2995 level for Ethereum. If this level holds, a rebound trend on the 4-hour timeframe will be initiated. Keep an eye on resistance levels near 3032, 3055, and 3095.
- If Ethereum falls below 2995 in the evening, the current rebound will end, and the 4-hour timeframe will continue to oscillate sideways. Watch out for support levels near 2960, 2915, and 2870.$BTC $ETH

