🔥🔥$ORDI price analysis from recent movement and data.🔥🔥
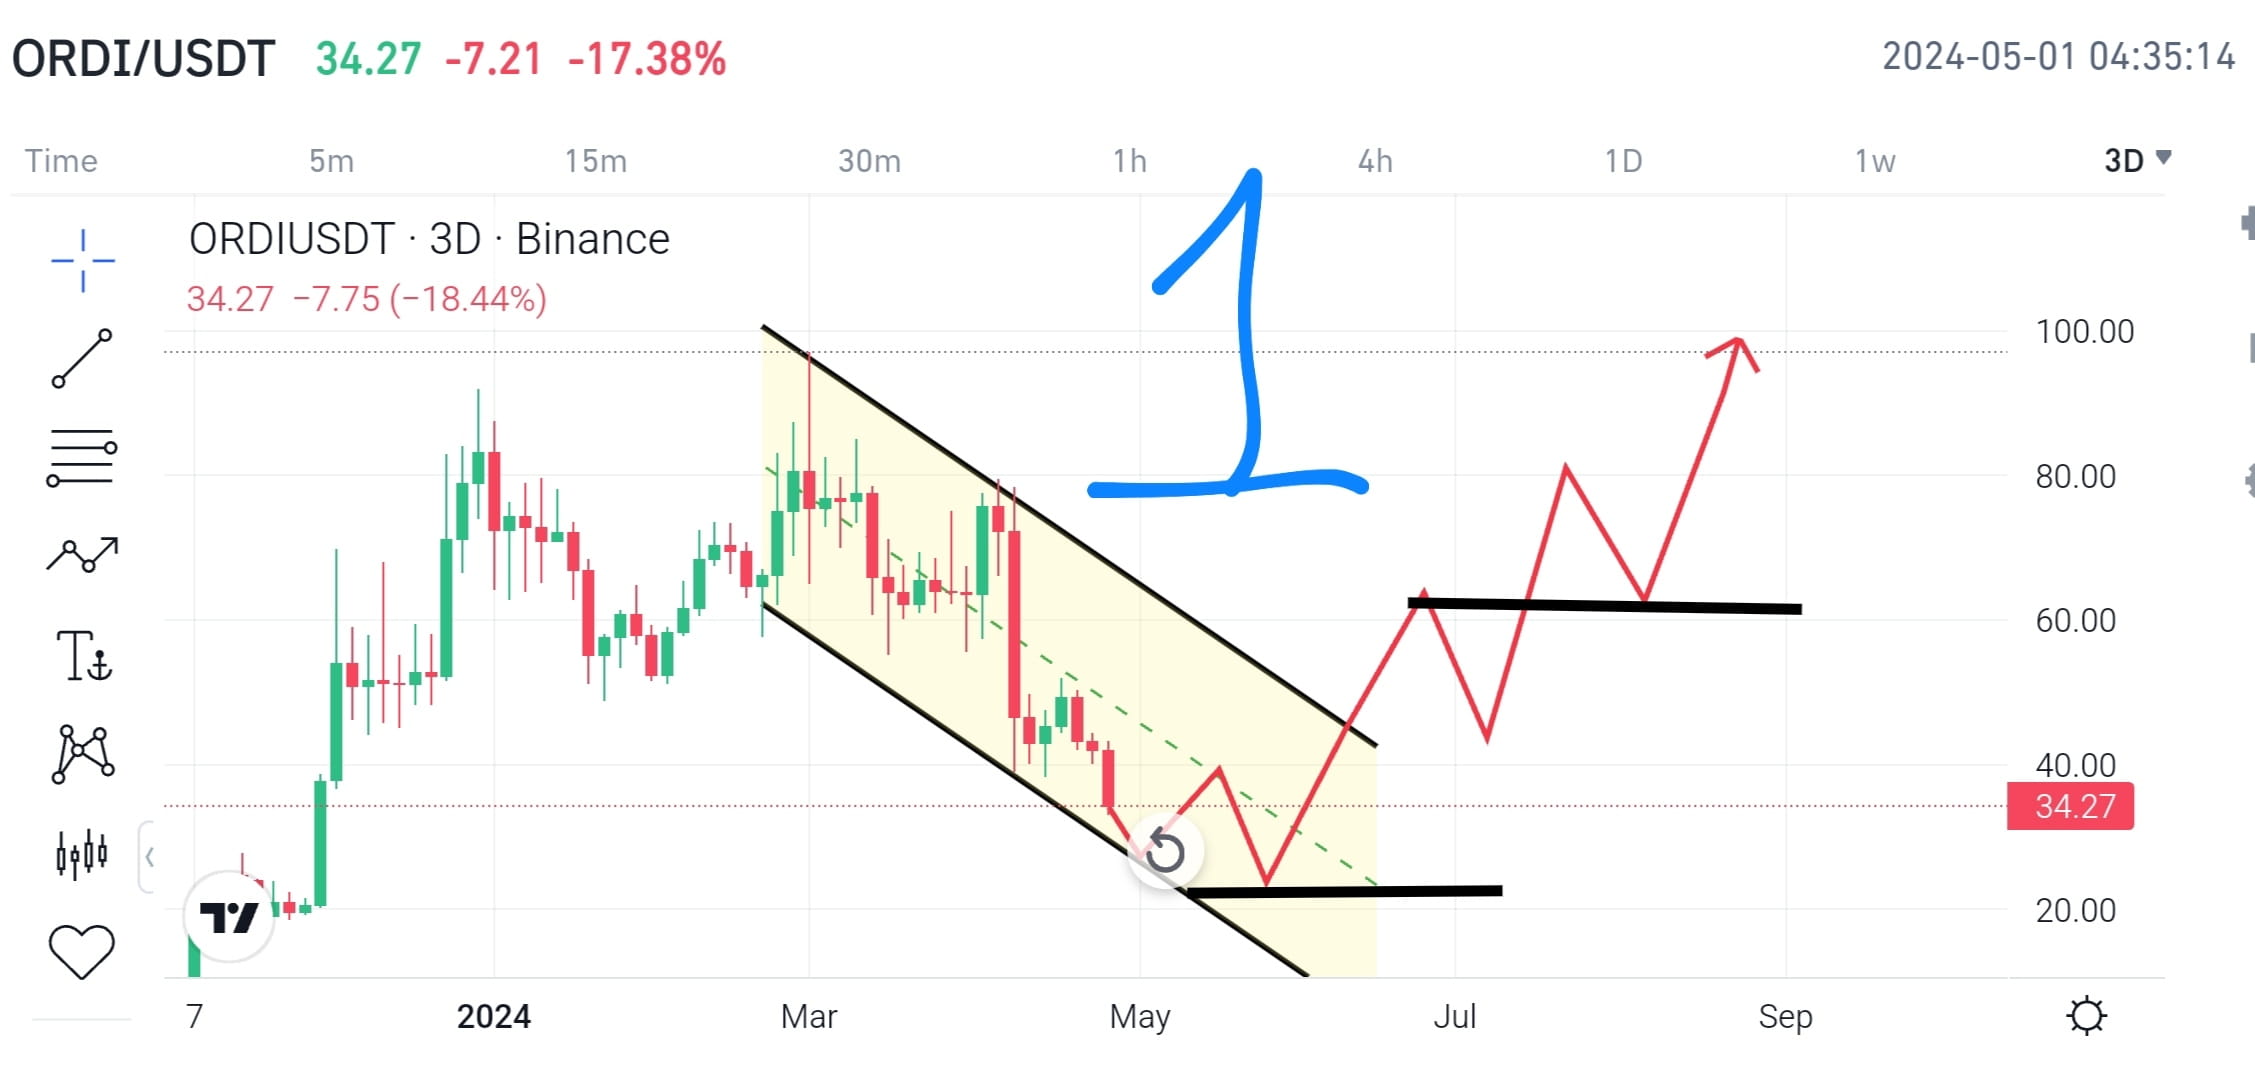
✅🔥 In Figure-1 chart it can be seen that $ORDI is approaching lower trendline or support of descending channel. It may be possible that it will bounce from the support and retest central trendline/resistance. If the retest fails it may cool down towards horizontal support as shown in the figure. From there it's highly likely that price goes up quickly and even breaks the upper trendline/resistance. This leads to good upward movement and ever smoothly goes towards the previous ATH during the next leg of the bull market.
✅🔥Figure-2 explains that if $ORDI took reversal from current situation then it may retest the central trendline/resistance but the bounce seems to be weak. It will probably come down and grab the liquidity sitting right around the bottom trendline/support. From there ORDI will highly probable to move upward but in case of failure it will consolidate in channel for some time. For upward price action the horizontal line is crucial for ORDI to hold. Both presented cases will be invalid in ordi fails to hold the bottom trendline of the descending channel.
✅🔥 Good times are ahead and DCA is good option/choice for those who bought at higher price. Patience means reward in this market. It is important to mention that the current market cap of ORDI is about 700m+. It performed well during the first phase of the bull market. So keep an eye on this as well. Gains will be solid.
📝📊✅After reading, please do press the follow button if you like, agree with the idea and for more important charts information. Your follow will be appreciation and motivation for me to continue. DYOR for financial activities. This is for educational and learning purposes.
#PEPE❤️ #BinanceLaunchpool #BullorBear #Megadrop #BitcoinETFs