🔥🚀🔥3 Phases of The Bitcoin Halving🔥🚀🔥
✅Final Halving Retrace (dark blue circle)
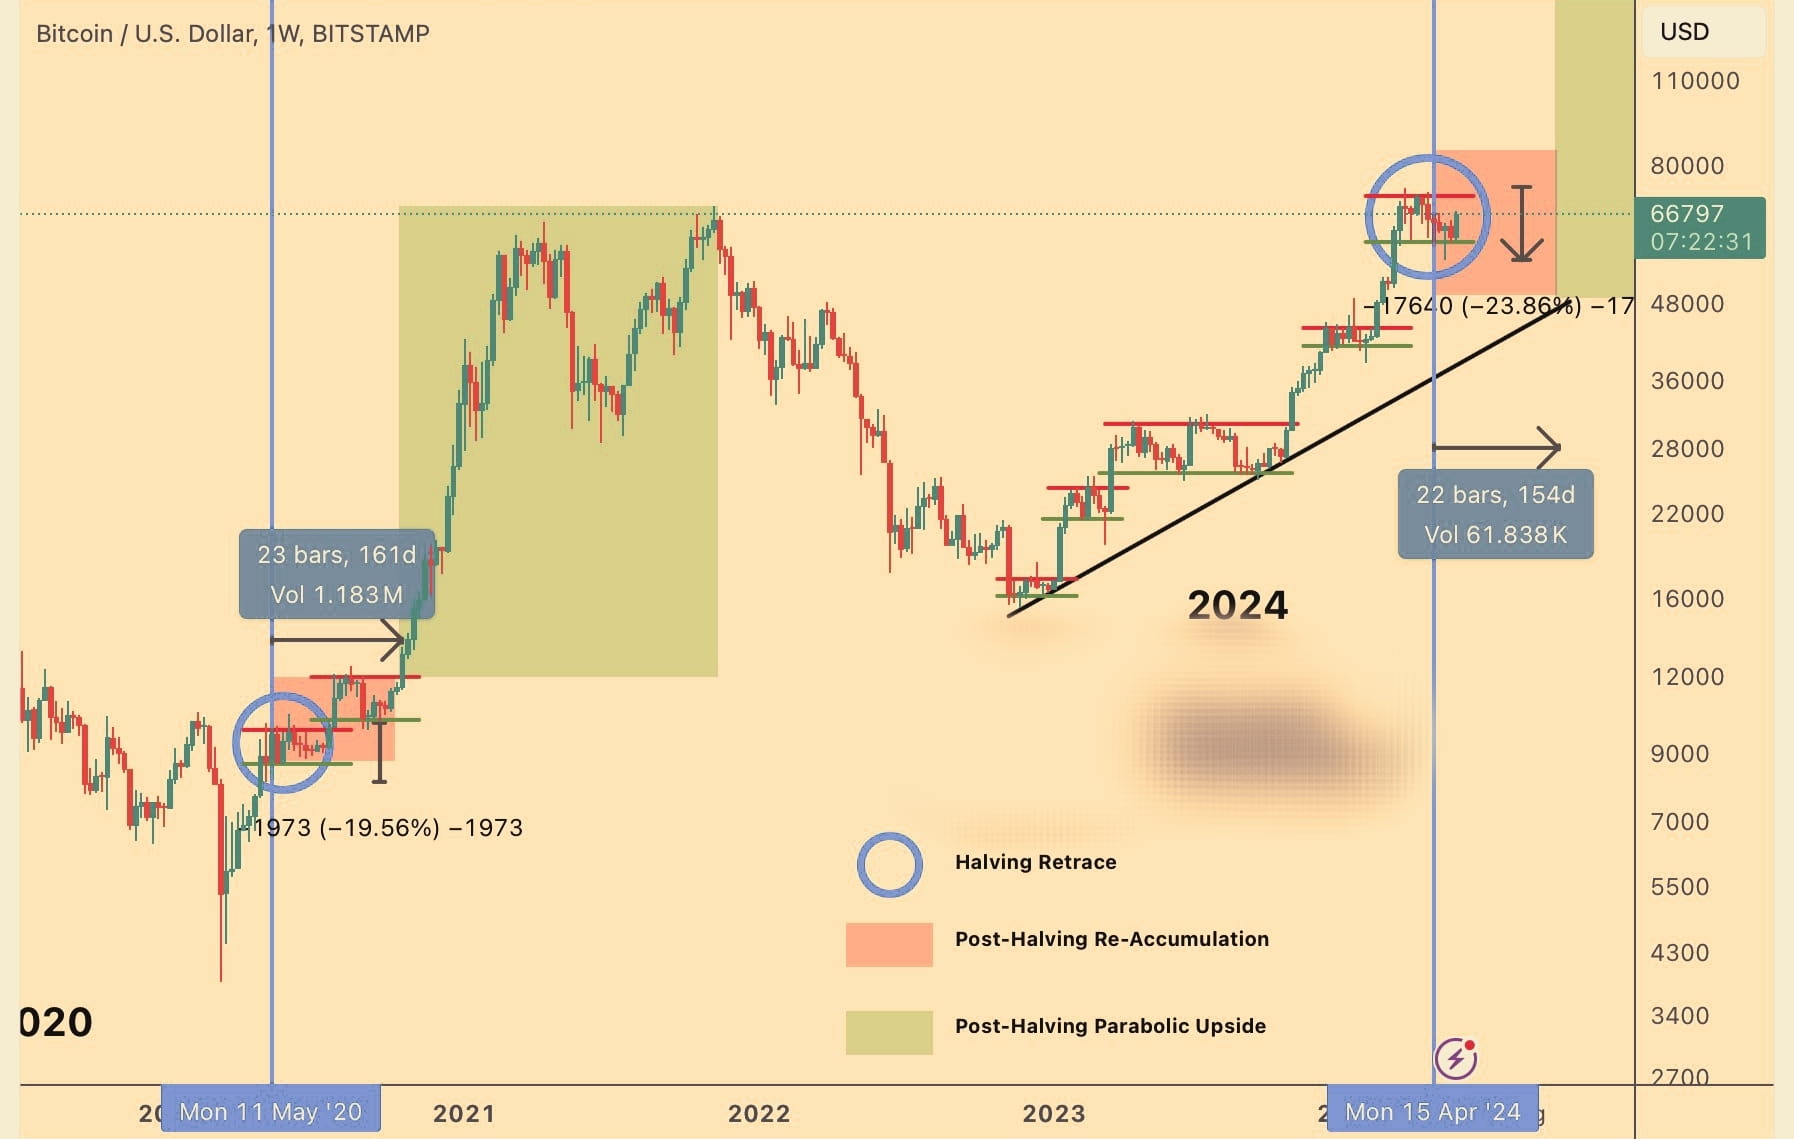
The Halving Retrace has already occurred and is in the books
In 2016, the Halving Retrace was -29% deep (-40% if you count the downside wick)
In 2020, the Halving Retrace was -19% deep
And in 2024, this Halving Retrace was -23.6% which has become the deepest retrace in the current cycle
This Halving Retrace is the final bargain-buying opportunity in the immediate Post-Halving period
✅ Re-Accumulation (red box)
Now that the Halving Retrace has occurred, it has set up the very foundations of the Re-Accumulation Range
This Re-Accumulation Range develops a few weeks before the Halving and concludes with a breakout from it weeks after the Halving
This Re-Accumulation Range is between ~$60000 and $70000, with wicks to either side of the range
The goal now is for Bitcoin to move sideways going into the Halving and beyond in preparation for the next phase in the cycle - the Parabolic Phase (green)
The Re-Accumulation phase can last several weeks, even up to 150 days (i.e 5 months)
Many investors get shaken-out in this stage due to boredom, impatience, and disappointment with lack of major results in their BTC investment in the immediate aftermath of the Halving
✅ Parabolic Uptrend (green box)
Once Bitcoin breaks out from the re-accumulation area breakout into the parabolic uptrend (green)
It is during this phase Bitcoin experiences accelerated growth into a parabolic uptrend.
🧑💻Please press follor for more updates and information. Dont't forget to like and share with others. Thank you.
DYOR for financial activities. NFA
$PEPE $FET $FTM #CryptoWatchMay2024 #altcoins #BTC #bitcoin #ETHETFS