杨锋锋哥
@yangFeng
指导交流-微博,微博搜索:杨锋锋哥,想要找到我的朋友可以通过微博,运用斐波那契技术指标和趋势图专注于以太,大饼。
Following
Followers
Liked
Shared
See original
Analysis of ETH market on September 26, layout in advance, yesterday's short position followed the decline of dozens of points, not very large!
Yesterday's short position followed the decline of only about 60 points, the decline was not large, the income was good, many posts I read basically followed, the recent market, this week is also in a volatile market, I have already said yesterday. It is oscillating between 2700 and 2522. Basically, the middle position is 2600. You can't go long or short at this position. You can actually make a small profit if you hold it for a longer time.
As for the trend chart, the trend chart of Bitcoin is strongly bullish. The lowest position of Bitcoin is 64,500, corresponding to the position of Ethereum is 2620, so the trend chart can be long at this position. It should break through the new high tonight.
ETH and BTC 4-6 hour technical indicators are generally bullish, especially MACD has taken away the top back structure and is bullish, which means that the bullish signal has just begun. Tonight is strongly bullish, KDJ is also crossing upward, and Ethereum forms a double top and continues to look at around 2700.
ETH evening strategy: long around 2620-2630, target around 2700! Don't look at the pin for the time being, the post is time-sensitive, click to follow!
#美国二季度核心PCE符合预期

杨锋锋哥
--
Bearish
Analysis of ETH market on September 25, layout in advance, a sharp rise after the interest rate cut of 50 basis points, and it has been fluctuating this week!
Since the sharp rise after the announcement of the interest rate cut, the market has been in a range of fluctuations. Bitcoin has been fluctuating around 63,000, and Ethereum has been fluctuating around 2640. Basically, you can short above and long below, and the fluctuation is not large.
The current trend chart of ETH is shown in Figure 1: As for the trend chart tonight, the general direction is downward, indicating that it is shorting at highs. The better position of the upper trend chart is around 2640, so short near this position or below this position, and look at 2560 below. If this position breaks through, look at the previous low around 2522.
ETH 4-6 hour technical indicators are shown in Figure 2: MACD is bearish. From the indicators, the fluctuation should be large, but the fluctuation is small in the past two days, indicating technical repair or shock adjustment. Then the upper pressure level 2675 is currently an important pressure level, and the lower support level is 2522. The current market is oscillating in this range of 2522-2675. You can focus on the high altitude tonight.
ETH evening strategy: short near 2620-2630, target near 2560, and pin near 2530. The post is effective. Click to follow!
See original
Analysis of ETH market on September 25, layout in advance, a sharp rise after the interest rate cut of 50 basis points, and it has been fluctuating this week!
Since the sharp rise after the announcement of the interest rate cut, the market has been in a range of fluctuations. Bitcoin has been fluctuating around 63,000, and Ethereum has been fluctuating around 2640. Basically, you can short above and long below, and the fluctuation is not large.
The current trend chart of ETH is shown in Figure 1: As for the trend chart tonight, the general direction is downward, indicating that it is shorting at highs. The better position of the upper trend chart is around 2640, so short near this position or below this position, and look at 2560 below. If this position breaks through, look at the previous low around 2522.
ETH 4-6 hour technical indicators are shown in Figure 2: MACD is bearish. From the indicators, the fluctuation should be large, but the fluctuation is small in the past two days, indicating technical repair or shock adjustment. Then the upper pressure level 2675 is currently an important pressure level, and the lower support level is 2522. The current market is oscillating in this range of 2522-2675. You can focus on the high altitude tonight.
ETH evening strategy: short near 2620-2630, target near 2560, and pin near 2530. The post is effective. Click to follow!
Since the sharp rise after the announcement of the interest rate cut, the market has been in a range of fluctuations. Bitcoin has been fluctuating around 63,000, and Ethereum has been fluctuating around 2640. Basically, you can short above and long below, and the fluctuation is not large.
The current trend chart of ETH is shown in Figure 1: As for the trend chart tonight, the general direction is downward, indicating that it is shorting at highs. The better position of the upper trend chart is around 2640, so short near this position or below this position, and look at 2560 below. If this position breaks through, look at the previous low around 2522.
ETH 4-6 hour technical indicators are shown in Figure 2: MACD is bearish. From the indicators, the fluctuation should be large, but the fluctuation is small in the past two days, indicating technical repair or shock adjustment. Then the upper pressure level 2675 is currently an important pressure level, and the lower support level is 2522. The current market is oscillating in this range of 2522-2675. You can focus on the high altitude tonight.
ETH evening strategy: short near 2620-2630, target near 2560, and pin near 2530. The post is effective. Click to follow!


See original
ETH market analysis on September 23, early layout, the bear market lasted for half a year, and the Ethereum bull market came late.
Ethereum fell from the highest of 4000 to the lowest of more than 2100 after half a year, which is equivalent to a bear market that lasted for half a year. Now it has finally ushered in the highlight moment of Ethereum. Many people have always said that Ethereum is just a copycat coin before. As long as it stands above 3000, it will continue to rise in the future.
Last week, it was also said that a 50 basis point interest rate cut is a big rise, and it is a sustained big rise, with a relatively strong and long cycle, because the three-day line and five-day line technical indicators are all bullish, so at least it can be seen that October is also bullish. At most, it is currently above 3000, and Bitcoin is around 70,000.
The ETH trend chart is shown in Figure 1: At present, the trend chart of Ethereum is upward. The trend of the market can be clearly seen in the chart, so the trend tonight is to continue to be bullish. If the current point of the decline is around 2240, the support below is near 2240, so it is the best position to go long near this position, first look at the upper 2730.
ETH 4-hour technical indicators are shown in Figure 2: MACD moves upward in the bottom back structure, KDJ looks up and other technologies are relatively unified and bullish, so tonight the general direction is bullish and combined with the trend chart to go long on dips, and then look at the lower support level near 2655, combined with the trend chart 2730, then you can go long in this range.
ETH evening strategy: go long near 2640-2650, target 2710, and pin near 2730. Detailed suggestions are quickly followed.


See original
Analysis of ETH market on September 19, layout in advance! After analysis, the general direction is bullish at the end of this month!
Yesterday's trend chart is shown in Figure 1: Opening this triangle trend chart is still very classic. This Figure 1 is the market trend drawn in advance yesterday, and it is also corresponding. The direction of the interest rate cut last night was also notified yesterday that everyone would enter the market at 2 o'clock. Basically, everyone who found me followed.
Popularize it: There are only three kinds of news in the market that will absolutely affect the market trend in the long run: First: BTC halving every four years, every time it reaches the last year in 2028, it will rise straight, second: ETF passed, third: announce interest rate hikes and interest rate cuts, interest rate cuts must be good news and will rise sharply, but it depends on 25 basis points or 50 basis points. If it is 50, it is long-term bullish, and vice versa. As long as you are interested in seeing the post posted yesterday saying that the interest rate cut will rise sharply by 50 basis points, you can enter the market in advance.
ETH 4-hour technical indicators are shown in Figure 2: As expected, MACD was downward last night. After the news was released, it turned upward and was strongly bullish. Looking at the 2-day-3-day line, the general direction is bullish. The highest point of this wave is around 3000, just like the 2800 at the end of last month told everyone to look at 2200. So long-term buy on dips, low and long fluctuations tonight.
ETH evening strategy: pullback to 2405-2415 to buy, target around 2475, upward pin to see 2500.


See original
Analysis of ETH market on September 18, layout in advance, the interest rate will be announced at 2:00 am tonight, and the speech will be at 2:30.
The posts I read yesterday and the day before yesterday or those who consulted me about the general direction are all accurate. Although Ethereum did not fluctuate much, it also had 50 points. It was sideways at 2300 tonight, which was to absorb funds, and then wait for the announcement of the interest rate!
The announcement of the interest rate at 2:00 am means a rate hike or a rate cut. At present, it is confirmed that a rate cut is a positive. If it is a 50 basis point rate cut, then it will be a big rise. If it is a 25 basis point rate cut, then the fluctuation may not be so exaggerated. From the perspective of the 4-hour technical indicators, the general direction is empty, so from the indicators, it is not clear that there will be a 50 basis point rate cut. My personal guess is 25 basis points, for reference only.
The ETH trend chart is shown in Figure 1: The trend chart of the interview is a special trend chart, a triangular trend. The triangular trend means that the market will continue to shrink, and then break through the trend to expand the market. It is very reasonable to combine it with the news tonight. At present, it will rebound upward when it touches the lower trend line near 2280, and it will pull back downward when it touches the upper trend line 2366. Therefore, the trend chart is not very clear. We can only say that we should focus on these two positions. Once it breaks through, it will break the market and expand.
ETH 4-hour technical indicators are shown in Figure 2: KDJ crosses downward. It has been said before that if it crosses, it must be strongly bearish, but if major good news appears, it will also change the technical indicators. MACD is going down and the structure is downward. At present, this position is also easy to reverse. It is not used as a reference. From the technical indicators, it is empty, but from the triangle area, it is low and more plus shock. For operation, you can do a small range, mainly high and empty.
ETH evening strategy: short near 2310-2320, target near 2260, and pin near 2250


See original
September 16th ETH market analysis, advance layout, keep up with the total return for three consecutive days last week and make a lot of money, strongly bearish tonight!
Last week, the highest point for shorting was prompted for three consecutive days. It is no longer a textbook-level advance prediction. Ethereum almost predicted the highest positioning error within one point, so the positions that followed were doubled. As for how much you have earned, you can take the money and rest. Only this Friday did not post, because the trend line broke through and the market moved faster, and I have emphasized in the comment area or found me that you can seize a few opportunities to turn over the position, and it is just the same as the prediction.
The ETH trend chart is shown in Figure 1: It is currently in a triangle downward direction and bearish. Once the trend triangle is broken, a big crack will form, which is a waterfall. As for the lowest position, it depends on the situation around 2150, but this is a general direction. It may not be tonight, but this week. The top of the current trend chart is around 2300-2310, so this position is also the best position for shorting.
ETH 4-hour technical indicators are shown in Figure 2: MACD reverses downward, which is a strong bearish signal. KDJ 4 to 6 hours is also directly downward, indicating that the general direction is short. The upper pressure level is 2355, so you can short the stop loss when it is close to this position, and the lower support level is 2220, so the lowest level tonight is around this position.
ETH evening strategy: short around 2300-2310, target around 2240, and pin around 2220. Please follow us for detailed guidance


See original
Analysis of ETH market on September 12, layout in advance, layout mainly short for three consecutive days this week, the highest point of the layout is very accurate!
Tonight is the third consecutive day this week that the high-altitude layout is mainly for the highest point of the rebound. The day before yesterday and yesterday were very perfect advance predictions. This trend chart was posted last week, and today is the fourth time this trend chart has been posted. As long as you open this trend chart carefully and watch it, you can short or follow the post to short with a very accurate return of more than 60 points and 200% return! Whether it is a pending order or a direct market price high-altitude layout, there are returns of more than 200%.
The current trend chart is getting lower and lower, indicating that the market is getting lower and lower. At present, the highest point above the trend chart tomorrow morning is around 2375, so this is another best position for shorting. Yesterday, the upper high-altitude 2380 to 2390 was the best shorting position, and tonight 2360 to 2370 was the best shorting position. The decline is more than 40 points and the return is 200%. But once this trend line stands firm and breaks upward, it will be a big rise, because the interest rate will be announced next week, and this trend chart may be broken if there is a positive trend, so hurry up and seize the opportunity. Seizing one or two opportunities can be enough for a month.
ETH's upper pressure is 2361, and the lower support is 2316. If the support level breaks through, it will be 2280. At present, the 4-hour technical indicators are also crossing downward. MACD has not closed red. You can wait patiently for a big drop after closing red. The operation is mainly based on high altitude according to this trend chart. Once the trend chart breaks through, don't short. If there is no breakthrough, it is mainly short.
ETH strategy: short near the rebound 2360-2370, the target is 2300, and the pin is near 2280. Click to pay attention to the details.


See original
ETH market analysis on September 11, layout in advance, textbook-level advance prediction in yesterday's post!
The trend line in yesterday's post is completely textbook-level, predict in advance! There is no error of a point. You can open the highest point 2400 above the first trend chart in the picture. It just hits this position 2400, and then pulls back downward. I and those who follow the post directly take profits.
Many people also say that this market is today's post and yesterday's post. How can it be predicted in advance? Because sometimes the trend chart is very accurate, it can be said to be ridiculously accurate, but there are not many times a month, so you can seize the opportunity to follow one or two times to turn over the position.
The CPI was indeed announced tonight, which is good news, but why did it fall? The first is that the technical indicators fell relatively. The second is that even if the interest rate cut is announced, it is related to 25 basis points and 50 basis points. Only a 50-point reduction will cause a big rise, but the probability is relatively small and 25 basis points are not painful, so this is why many people don’t know the fluctuations brought about by the interest rate cut.
The trend chart of ETH has not changed. It can be seen from this chart that the pressure level of the upper trend chart must have become smaller again. At present, it is at 2393, which means that the maximum pressure level above is 2393, which is seven points less than yesterday's 2400. So it can be said that it is still 10 points lower than yesterday's point to short!
ETH strategy: short near the rebound of 2350-2360, and then get it near 2300. Detailed guidance is coming soon!
杨锋锋哥
--
Bearish
ETH market analysis on September 10, advance layout, the general direction of the layout at the end of last month has also reached the lowest position perfectly!
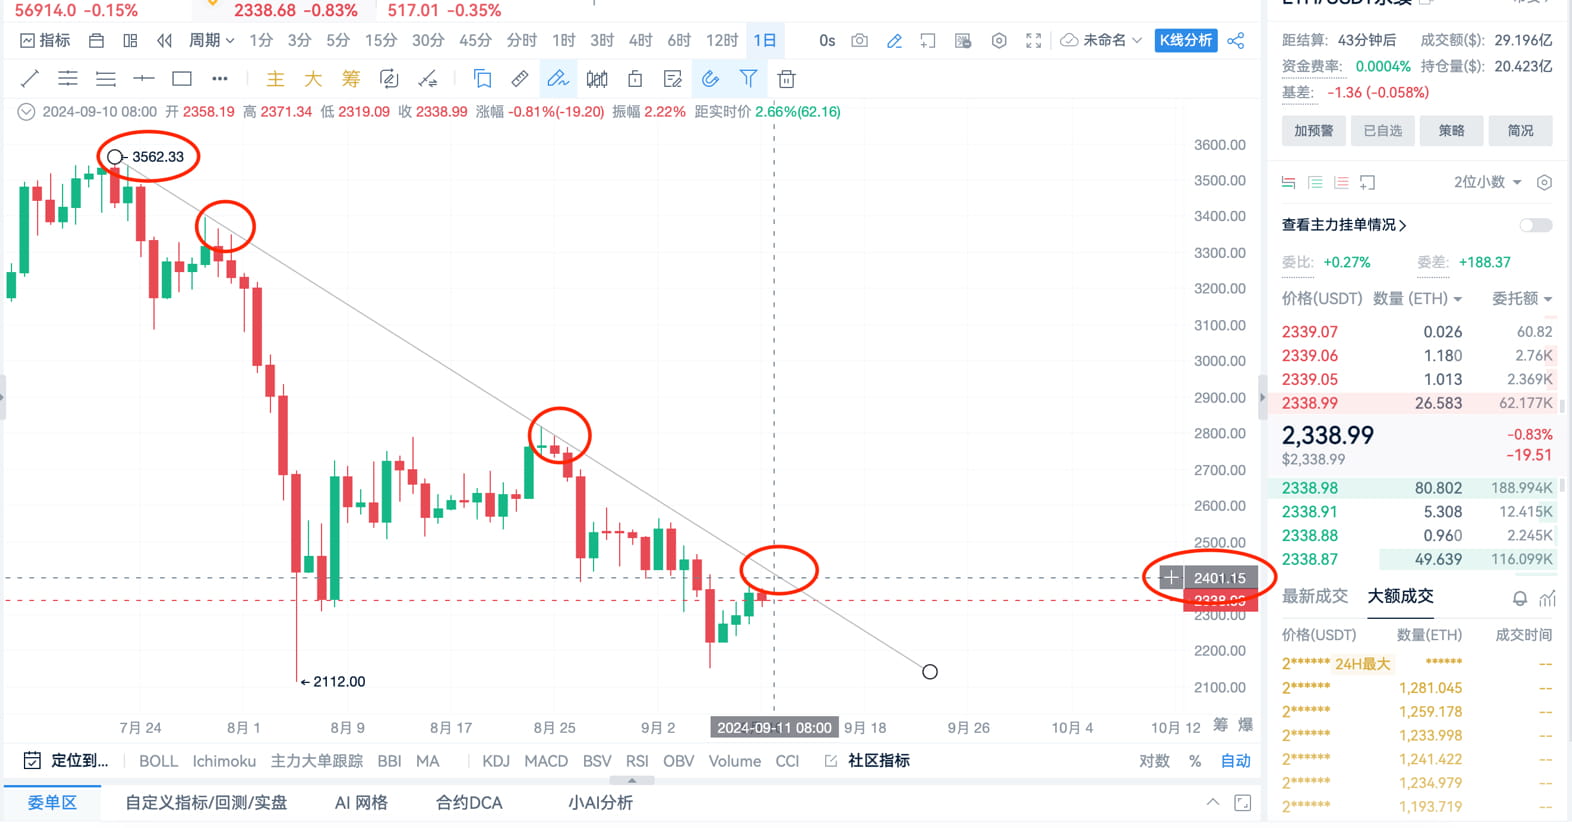
On the last day of last month, the general direction of Ethereum at the beginning of this month was analyzed. It was very accurate. It can be said to be a textbook-level advance layout. When you open the daily line, you can see that a double bottom structure has been formed. The lowest 2111 and 2150 below Ethereum formed a double bottom. Last week, it was also twice in a row, allowing everyone to layout below 2200. As long as you study carefully and find me, you will give this lowest general direction idea perfectly.
ETH daily trend chart is shown in Figure 1: This trend chart is very accurate. You can see that the general direction of the whole month was also prompted once last month. The last time this month prompted the general direction, it almost touched this trend line and would pull back downward. This is the fourth time that it is close to this trend line. The highest position of the trend line is around 2400, so the highest rebound this time will also look at this position, and then it will retreat downward when it touches this position. This position is the best short position. Then the interest rate cut will be announced this month. You can focus on this trend crossover. Once it breaks through and stabilizes, it will definitely rise sharply. Once it hits this, it will definitely fall sharply. Ethereum will catch a unilateral market and it will be 200 points.
ETH. The 4-hour technical indicators should be as shown in the figure: KDJ crosses downward, then it is strongly bearish. MACD has actually been reversing and closing, but it is currently closing downward, so the technical indicators are uniformly bearish, but the 8-12 hour technical indicators are bullish, so it is not a big unilateral market. The pressure level of Ethereum is 2360 and 2408. Basically, these two positions are the positions for shorting. It is safer to focus on high altitude tonight.
ETH evening strategy: short near the rebound of 2360-2370, the target is near 2300, and the pin is near 2280. There are not posts every day. Please pay attention to detailed guidance!

See original
ETH market analysis on September 10, advance layout, the general direction of the layout at the end of last month has also reached the lowest position perfectly!
On the last day of last month, the general direction of Ethereum at the beginning of this month was analyzed. It was very accurate. It can be said to be a textbook-level advance layout. When you open the daily line, you can see that a double bottom structure has been formed. The lowest 2111 and 2150 below Ethereum formed a double bottom. Last week, it was also twice in a row, allowing everyone to layout below 2200. As long as you study carefully and find me, you will give this lowest general direction idea perfectly.
ETH daily trend chart is shown in Figure 1: This trend chart is very accurate. You can see that the general direction of the whole month was also prompted once last month. The last time this month prompted the general direction, it almost touched this trend line and would pull back downward. This is the fourth time that it is close to this trend line. The highest position of the trend line is around 2400, so the highest rebound this time will also look at this position, and then it will retreat downward when it touches this position. This position is the best short position. Then the interest rate cut will be announced this month. You can focus on this trend crossover. Once it breaks through and stabilizes, it will definitely rise sharply. Once it hits this, it will definitely fall sharply. Ethereum will catch a unilateral market and it will be 200 points.
ETH. The 4-hour technical indicators should be as shown in the figure: KDJ crosses downward, then it is strongly bearish. MACD has actually been reversing and closing, but it is currently closing downward, so the technical indicators are uniformly bearish, but the 8-12 hour technical indicators are bullish, so it is not a big unilateral market. The pressure level of Ethereum is 2360 and 2408. Basically, these two positions are the positions for shorting. It is safer to focus on high altitude tonight.
ETH evening strategy: short near the rebound of 2360-2370, the target is near 2300, and the pin is near 2280. There are not posts every day. Please pay attention to detailed guidance!


See original
Analysis of ETH market on September 6, layout in advance, the trend chart is still mainly high and empty as yesterday!
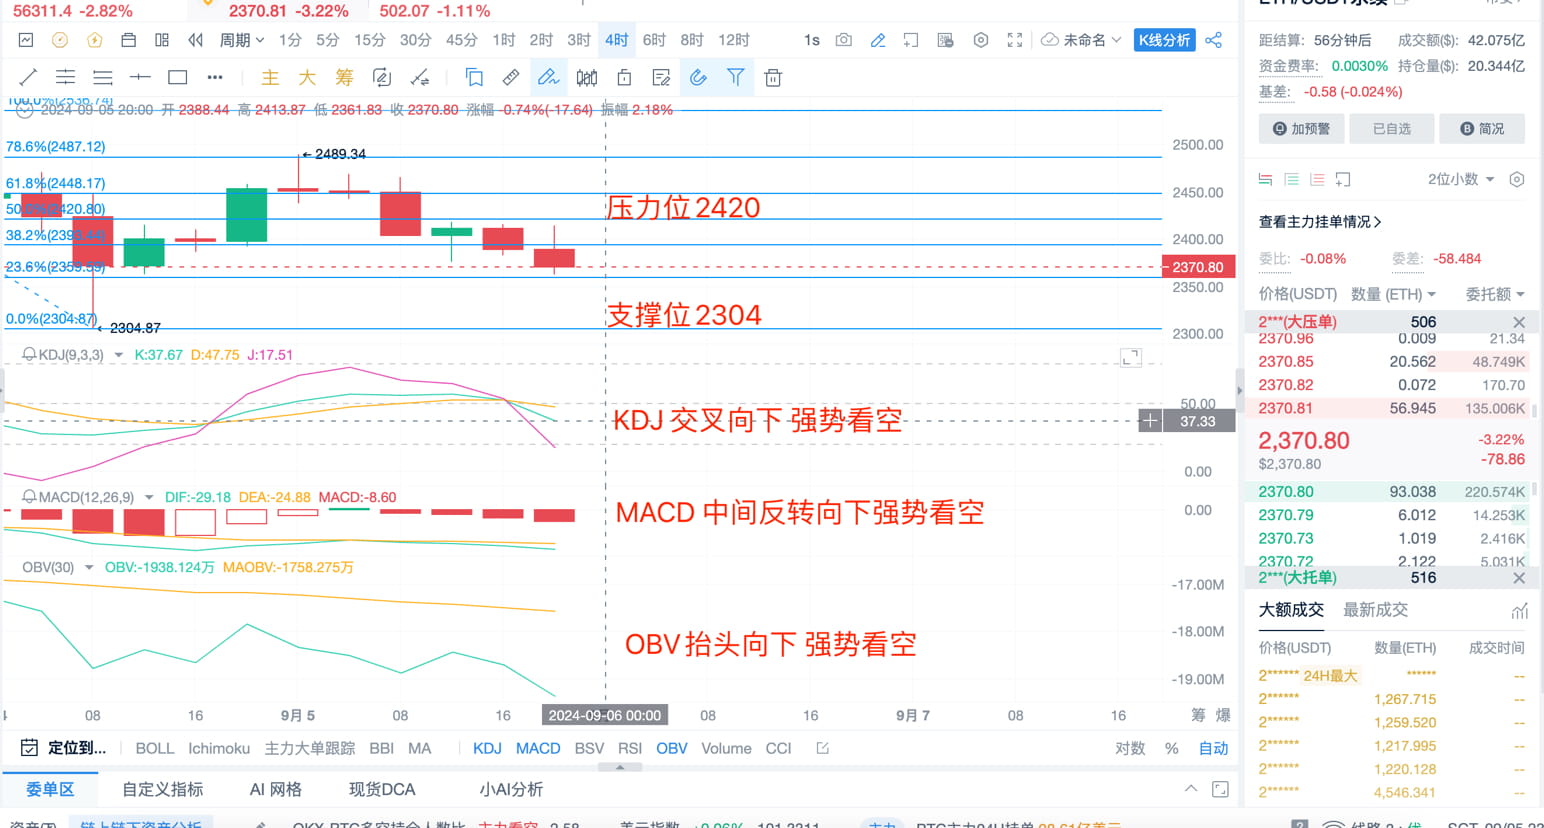
The trend chart of Ethereum is still the same as yesterday, the general direction remains unchanged and mainly high and empty. The profits of those who followed the posts I read yesterday and found me for consultation or left messages were not bad. The upper pressure of Ethereum is at 2417, so as long as this position does not break through, it is still close to this position to short. Yesterday and today, there were four times of shorting near 2410, and those who followed can take the profit.
Focus on translating. I drew a daily trend chart two days ago, which is very accurate. After looking at the trend chart, you will feel very surprised that it is too accurate. The trend chart of the daily line is basically under pressure and rebounded. The position is constantly moving downward, so the high point is constantly moving downward. Now it has moved to 2490. What does it mean? 2490 is the current highest point, which is difficult to break through unless there is major news. Therefore, it is safer to short at 2400, because the highest increase is only a few dozen points.
ETH 4-hour technical indicators: You can open KDJ and see that it has crossed downward, indicating that the crossover is strongly bearish. The lower support of Ethereum is 2345, which is why it fell to around 2345 tonight and rebounded, and then it will fall back to around 2400. If 2435 is not stable, it will break through directly and continue to look at 2300. Tomorrow is the weekend market again.
ETH: The strategy is still to short near 2400, and the lowest level is still around 2300. The operation is mainly high, and detailed guidance is urgent!
杨锋锋哥
--
Bearish
Analysis of ETH market on September 5, layout in advance, strong bearish in the general direction.
Yesterday's daily trend chart made it clear that the highest Ethereum 2530 is a heavy pressure point. From July 22 to now, every time it will be under pressure from this trend line. The current upper pressure is at 2530, so this position is very safe. If you short in the medium and long term, stop loss is placed at this position, or you can go short directly near 2500. The general direction of this month is still bearish.
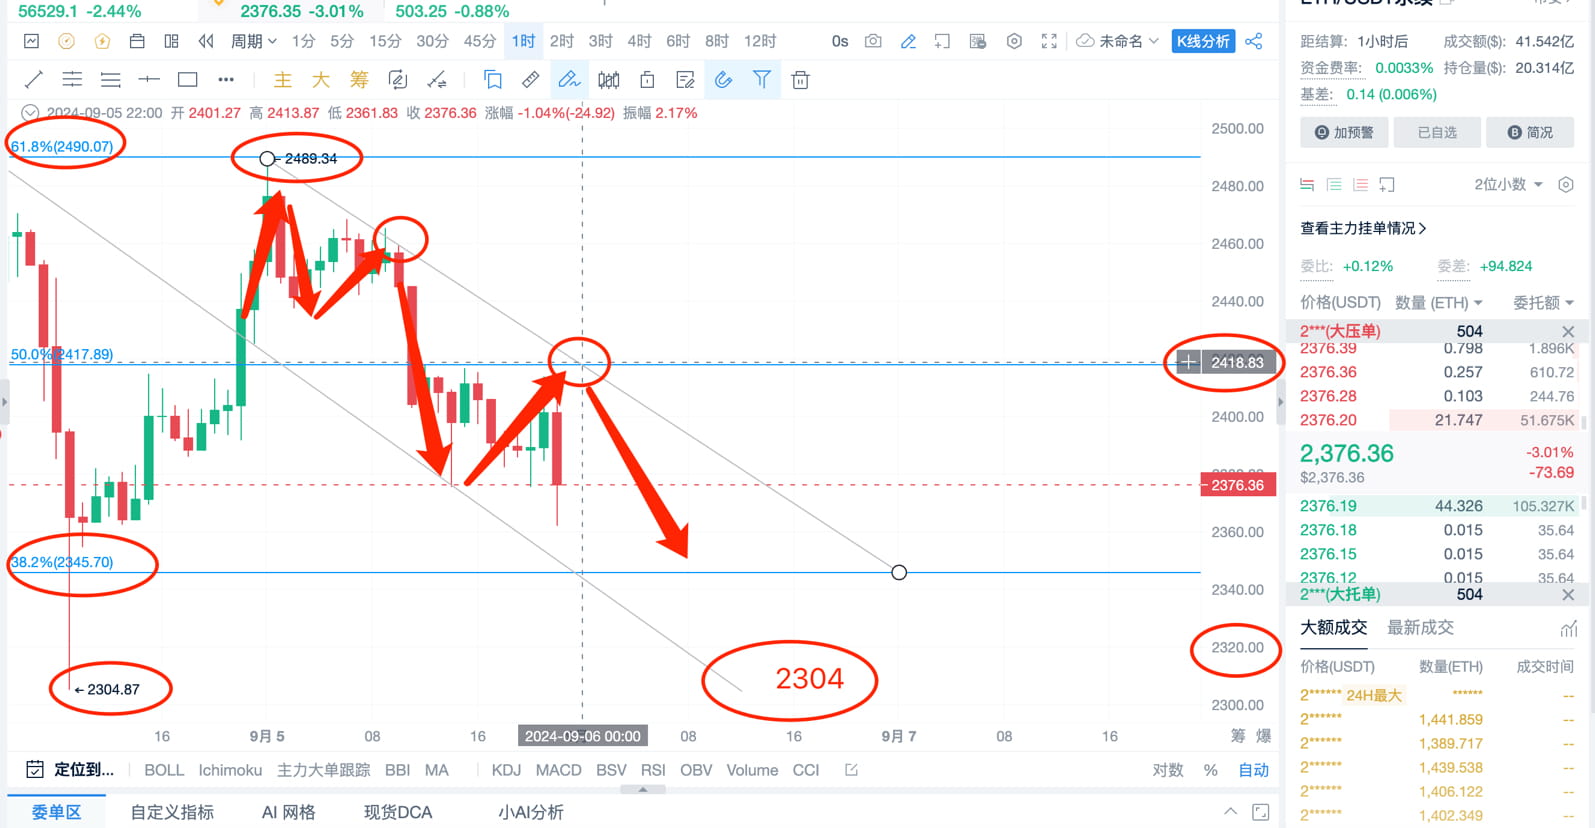
The ETH trend chart is shown in Figure 1: At present, a trend chart has been formed. There has been no trend chart in the past two days. The trend chart is a parallel line downward, so the general direction is bearish. At present, it will pull back downward when it encounters the trend line. The red circle has been drawn on the way. The upper cross position is near 2417, so tonight it has been tested twice at 2415 and has not broken through, and then it goes down, so it can be shorted near this position.
The trend line is also the cross point above the watershed at 2417. If it breaks through and stands firm, it will be strongly bullish, but if it fails to break through, it will fall sharply downward.
ETH 4-hour technical indicators are shown in Figure 2: KDJ has crossed downward, which means it is strongly bearish. Crossing downward means it is strongly bearish, and looking up and downward means it is only temporarily bearish. MACD made a reversal downward, which is also a strong bearish signal. So from the technical indicators, the stretch last night was just to lure more, and the operation was mainly high-altitude.
ETH evening strategy: short around 2410-2420, target around 2430, and pin around 2315! Click to follow for detailed guidance!
Yesterday's daily trend chart made it clear that the highest Ethereum 2530 is a heavy pressure point. From July 22 to now, every time it will be under pressure from this trend line. The current upper pressure is at 2530, so this position is very safe. If you short in the medium and long term, stop loss is placed at this position, or you can go short directly near 2500. The general direction of this month is still bearish.
The ETH trend chart is shown in Figure 1: At present, a trend chart has been formed. There has been no trend chart in the past two days. The trend chart is a parallel line downward, so the general direction is bearish. At present, it will pull back downward when it encounters the trend line. The red circle has been drawn on the way. The upper cross position is near 2417, so tonight it has been tested twice at 2415 and has not broken through, and then it goes down, so it can be shorted near this position.
The trend line is also the cross point above the watershed at 2417. If it breaks through and stands firm, it will be strongly bullish, but if it fails to break through, it will fall sharply downward.
ETH 4-hour technical indicators are shown in Figure 2: KDJ has crossed downward, which means it is strongly bearish. Crossing downward means it is strongly bearish, and looking up and downward means it is only temporarily bearish. MACD made a reversal downward, which is also a strong bearish signal. So from the technical indicators, the stretch last night was just to lure more, and the operation was mainly high-altitude.
ETH evening strategy: short around 2410-2420, target around 2430, and pin around 2315! Click to follow for detailed guidance!
See original
Analysis of ETH market on September 5, layout in advance, strong bearish in the general direction.
Yesterday's daily trend chart made it clear that the highest Ethereum 2530 is a heavy pressure point. From July 22 to now, every time it will be under pressure from this trend line. The current upper pressure is at 2530, so this position is very safe. If you short in the medium and long term, stop loss is placed at this position, or you can go short directly near 2500. The general direction of this month is still bearish.
The ETH trend chart is shown in Figure 1: At present, a trend chart has been formed. There has been no trend chart in the past two days. The trend chart is a parallel line downward, so the general direction is bearish. At present, it will pull back downward when it encounters the trend line. The red circle has been drawn on the way. The upper cross position is near 2417, so tonight it has been tested twice at 2415 and has not broken through, and then it goes down, so it can be shorted near this position.
The trend line is also the cross point above the watershed at 2417. If it breaks through and stands firm, it will be strongly bullish, but if it fails to break through, it will fall sharply downward.
ETH 4-hour technical indicators are shown in Figure 2: KDJ has crossed downward, which means it is strongly bearish. Crossing downward means it is strongly bearish, and looking up and downward means it is only temporarily bearish. MACD made a reversal downward, which is also a strong bearish signal. So from the technical indicators, the stretch last night was just to lure more, and the operation was mainly high-altitude.
ETH evening strategy: short around 2410-2420, target around 2430, and pin around 2315! Click to follow for detailed guidance!


See original
Analysis of ETH BTC market on September 4, layout in advance, the overall direction this week is bearish!
The strategy released on Monday is very accurate. Ethereum has a 60-point profit, a 300% profit. Yesterday also ushered in a big drop. At the end of last month, the overall general trend of this month was analyzed. From Figure 1, you can clearly know why there was a big drop yesterday. It can be said to be very accurate.
The ETH trend chart is shown in Figure 1: This is an overall general trend chart. Basically, it will pull back downward when it touches this trend line. Yesterday's highest point of 2564 was just close to the trend line and was under pressure, so it will definitely pull back downward. This is why this position will drop by more than 200 points. The trend line is constantly moving downward. The best position for shorting next time is around 2530. If you rebound to this position to short, the decline will be relatively large. You can focus on the area around 2530.
BTC 4-hour technical indicators are shown in Figure 2: KDJ is rising and going down, MACD is also continuing to close in red and moving downward, and the divergence structure is strongly bearish. Recently, Ethereum has followed Bitcoin, so you can just look at Bitcoin technical indicators. The upper pressure of Ethereum is around 2417. This wave of decline may continue to close the double bottom structure this week and continue to look at around 2300. So it is more appropriate to go short near this position 2417 tonight, mainly high.
ETH evening strategy: short near the rebound 2410-2420, the target is around 2345, and the downward pin is below 2400. Detailed guidance is coming soon. Those who do Ethereum can click to follow.


See original
ETH market analysis on September 2, advance layout, Ethereum double bottom M pattern!
Ethereum formed a double bottom pattern in 4 hours, a very classic M structure. The lowest point of the double bottom is around 2490, which is also a strong support level and a long position. This corresponds to Friday's high-altitude, and the lowest point is around 2490.
The general direction is relatively accurate without any problems, but it is a little early for everyone to enter the short position. At present, this double bottom M structure has a trend line crossing position, which is the long position. The cross-long position just coincides with the Ethereum Fibonacci 2493, which is more suitable for long positions.
There will be unemployment benefits news released every Thursday this month, and the interest rate hike will be announced on the 19th of this month, so the market will definitely fluctuate greatly. Once there is news, the technical indicators will be unstable, so you can focus on it.
ETH 4-hour technical indicators are as shown in the figure: The technical indicators of Ethereum 4 hours are basically based on Bitcoin. At present, the 4-hour KDJ Bitcoin is strongly bullish with a cross-upward trend. MACD has just started to move up and down. Technical indicators show that Bitcoin is strongly bullish tonight. It is possible to fall unless MACD closes red at 4:00 a.m. The current upper pressure of Ethereum is 2591. If it breaks through this position tonight, you will also form a double top structure. If this position goes up, the pressure is also relatively large. Comprehensive analysis shows that the operation is mainly low and long at night.
ETH evening strategy: long near 2490-2500, target 2570, and pin near 2590. The post is time-sensitive. Please pay attention to the detailed guidance.


See original
Analysis of ETH market on August 30, layout in advance, the last day of this month closed with a big negative line, and the general direction of next month is bearish. Special indicators were also issued tonight to be bearish.
The news will be released at 8:30 this evening. The US GDP report will be released on Friday. As the market expects Bitcoin to fall, the overall direction is still bearish before the interest rate cut.
Last night, as Bitcoin technical indicators continued to move downward, Ethereum also fluctuated, and a small stop loss was also normal. The special indicators that appeared tonight are bearish. Just look at the post to know that the special indicators have fluctuated greatly, and it is a one-sided market.
On the last day of this month, ETH can judge the general direction of next month through the daily and weekly lines. According to the wave structure as shown in Figure 1: It is currently moving in the C wave of the wave structure downward, so it can be judged that the general direction of next month is to be bearish. If the lowest is seen near 2100, it is also possible that it will reach this position next week, so those who are laying out spot and medium and long-term can focus on this position.
ETH 4-hour trend chart As shown in Figure 2: The overall direction is bearish, and this weekend may be dominated by high-altitude trading. Ethereum used to secretly make up for the rise, but the probability of Ethereum making up for the rise this weekend is not high. At present, the upper pressure level of Ethereum is 2523, and it is better to short at this position. There is no need to look at the technical indicators of 4 hours to 6 hours. The indicators of the downward market smashing the market today are definitely downward, so they are not used as a reference. Combined with the emergence of special indicators, the high-altitude trading is mainly tonight.
ETH strategy: short at 2470-2480, the target is around 2380, and the pin is around 2350. Detailed guidance is urgent.


See original
Analysis of ETH BTC market on August 29, layout in advance, do more tonight if you are strongly bullish!
All the strategies laid out in advance this week are 100% accurate, keeping up with the big market for three consecutive days, and basically it is a one-sided market, so this week as long as you read the posts and keep up with the positions, you can directly put the money in the bag.
The BTC ETH trend chart is shown in Figure 1: The trend charts of Bitcoin and Ethereum are the same. The market is two parallel lines that are constantly moving upward. From the trend chart in the figure, you can clearly see that the big market is upward, so the general direction is bullish, so go long on dips and go long directly when you encounter the trend below. At present, the cross below the trend line is located near 2555, so it is best to go long near this position. Bitcoin is around 60500, so it is better to go long at this position. Everyone goes long on Bitcoin and the increase is relatively large.
ETH 4-hour technical indicators are shown in Figure 2: MACD has just reached the top structure, strongly bullish, OBV also showed an overbought signal, strongly bullish, combined with KDJ rising, very strong three important indicators, tonight unified bullish and unilateral market, the lower support is 2536, close to this position, you can directly go long, and the trend chart is similar.
ETH evening strategy: go long near 2550-2560, target near 2640, and go up near 2667. Bitcoin is long near 60500, detailed guidance is urgent.


See original
Analysis of ETH BTC market on August 27, layout in advance, the short orders arranged last night made a lot of money, and tonight we will continue to focus on high-altitude trading!
Last night, all the profits of those who read the posts and consulted me were over 200%, and the profits of those who left screenshots in the comment area were over 500%. Because it was a one-sided market, all the major indicators are still bearish at present, so I didn’t remind you to bring a stop loss, because as long as you open a short position, it’s a matter of how much you make, depending on how much you make. Is there anything else to say? Detailed guidance quickly.
Tonight, we will continue to focus on high-altitude trading. At present, the trend chart has not changed. The market has broken through the parallel lines below the trend chart. You can open the parallel line trend chart of the chart, then the bottom parallel line trend chart is the pressure position, and it will start to pull back downward when it touches the trend line, so the general direction is still focused on high-altitude trading.
Bitcoin and Ethereum continue to be bearish in the 4-hour and 6-hour technical indicators, and there is a high probability that a double bottom structure will be formed, that is, Ethereum continues to look below 2550 and Bitcoin continues to look below 61,000. The meaning of the double bottom structure is that the downward pin will be lower or near the last time. So operate high tonight. For Ethereum, it is best to short above 2600.
ETH's evening strategy is to short near the Fibonacci upper pressure level of 2600-2610. The target is around 2530, and the pin is around 2510. Detailed guidance is urgent.
杨锋锋哥
--
Bearish
ETH BTC latest market analysis for this week on August 26th is coming, layout in advance, the general direction is strongly bearish tonight!
This week starts a new market, Bitcoin and Ethereum are strongly bearish tonight. There is no news this week, only the unemployment benefits will be announced on Thursday, so you can focus on technical indicators.
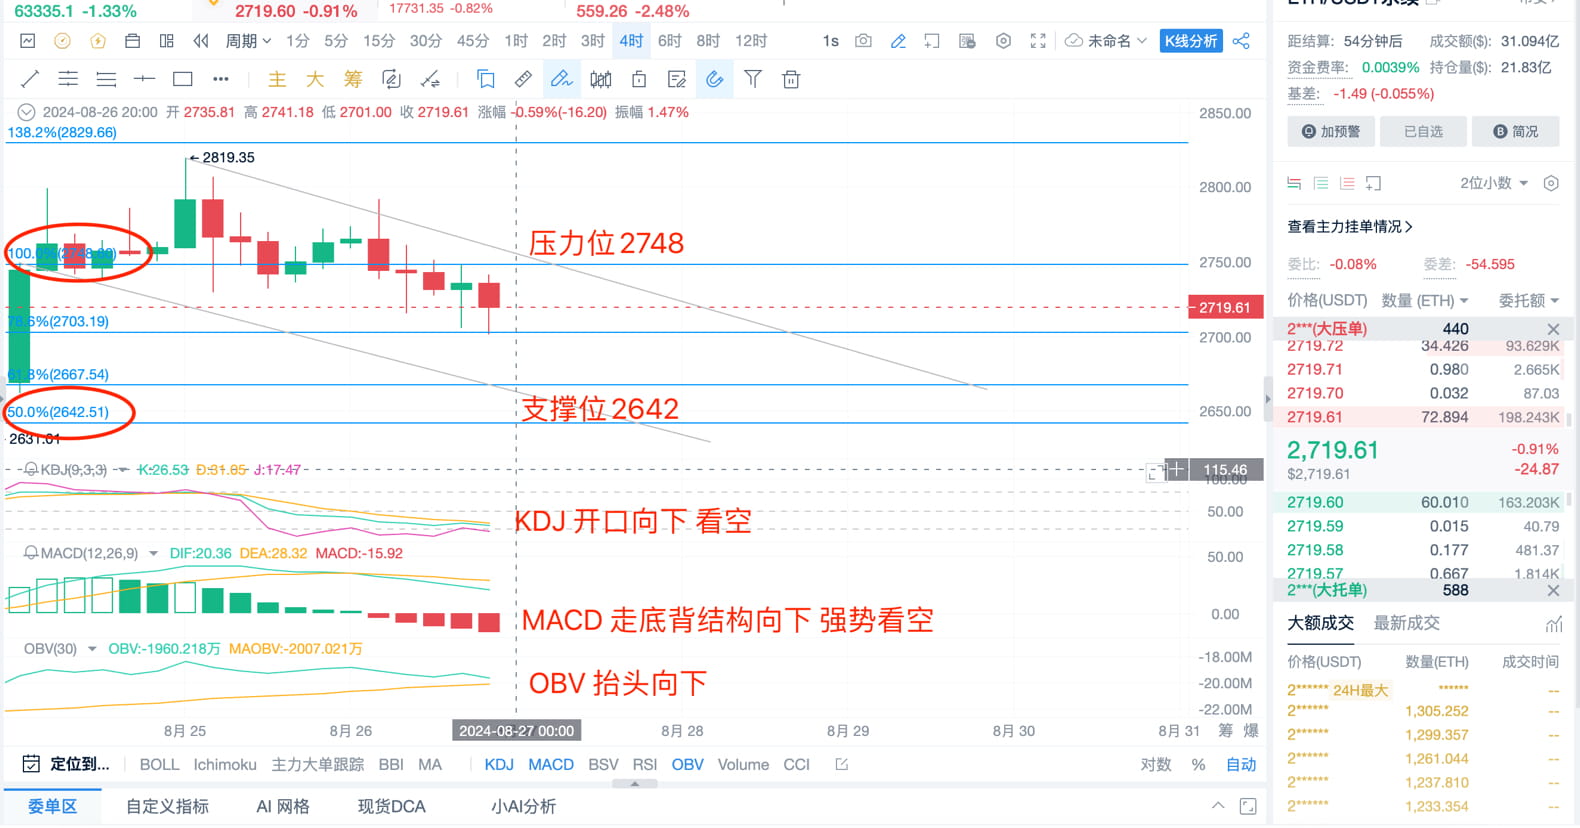
ETH trend chart is shown in Figure 1: From the figure, you can see that the trend chart is clear at a glance. The general direction is that the two trend lines of bearish are constantly moving downward. When they touch the upper trend line, they will pull back downward. At present, they have not reached the lower trend line. Therefore, according to the trend chart, it is best to short near the upper intersection, which is just near the pressure of 2748 Ethereum.
ETH technical indicators for 4 hours, as shown in Figure 2: MACD is strongly bearish in the bottom back structure, which is also an oversold signal. The two important indicators KDJ and OBV are also uniformly bearish. The 4-hour general direction technical indicators are uniformly bearish. Combined with the trend chart, it will fall a lot tonight. After the support level of Ethereum below 2667 is broken, look at 2640. So hurry up and do high altitude. Those who like to do Bitcoin can also leave a message in the comment area.
ETH evening strategy: short around 2730-2740, target around 2650, downward pin to around 2617. Detailed guidance is in order.
This week starts a new market, Bitcoin and Ethereum are strongly bearish tonight. There is no news this week, only the unemployment benefits will be announced on Thursday, so you can focus on technical indicators.
ETH trend chart is shown in Figure 1: From the figure, you can see that the trend chart is clear at a glance. The general direction is that the two trend lines of bearish are constantly moving downward. When they touch the upper trend line, they will pull back downward. At present, they have not reached the lower trend line. Therefore, according to the trend chart, it is best to short near the upper intersection, which is just near the pressure of 2748 Ethereum.
ETH technical indicators for 4 hours, as shown in Figure 2: MACD is strongly bearish in the bottom back structure, which is also an oversold signal. The two important indicators KDJ and OBV are also uniformly bearish. The 4-hour general direction technical indicators are uniformly bearish. Combined with the trend chart, it will fall a lot tonight. After the support level of Ethereum below 2667 is broken, look at 2640. So hurry up and do high altitude. Those who like to do Bitcoin can also leave a message in the comment area.
ETH evening strategy: short around 2730-2740, target around 2650, downward pin to around 2617. Detailed guidance is in order.

See original
ETH BTC latest market analysis for this week on August 26th is coming, layout in advance, the general direction is strongly bearish tonight!
This week starts a new market, Bitcoin and Ethereum are strongly bearish tonight. There is no news this week, only the unemployment benefits will be announced on Thursday, so you can focus on technical indicators.
ETH trend chart is shown in Figure 1: From the figure, you can see that the trend chart is clear at a glance. The general direction is that the two trend lines of bearish are constantly moving downward. When they touch the upper trend line, they will pull back downward. At present, they have not reached the lower trend line. Therefore, according to the trend chart, it is best to short near the upper intersection, which is just near the pressure of 2748 Ethereum.
ETH technical indicators for 4 hours, as shown in Figure 2: MACD is strongly bearish in the bottom back structure, which is also an oversold signal. The two important indicators KDJ and OBV are also uniformly bearish. The 4-hour general direction technical indicators are uniformly bearish. Combined with the trend chart, it will fall a lot tonight. After the support level of Ethereum below 2667 is broken, look at 2640. So hurry up and do high altitude. Those who like to do Bitcoin can also leave a message in the comment area.
ETH evening strategy: short around 2730-2740, target around 2650, downward pin to around 2617. Detailed guidance is in order.


See original
Analysis of ETH BTC market on August 23, review today, the profit of following the long orders of Ethereum last night was more than 200%.
Last night was also a one-sided market. As long as many people read the post and opened long orders, they earned 100% to 200%. Many people also asked me to open Bitcoin. The profit of long Bitcoin is also good, because the trend chart is still very accurate, and both trend charts are uniformly bullish. What else can I say? Detailed guidance on operation is hurry up.
In combination with the trend chart, there are still two trend lines that are moving upward. The operation is mainly low-to-long. The technical indicators last night were not very clear. If the technical indicators and trend charts are uniformly upward tonight, it means that there will be a big rise. If the technical indicators are still downward, it is possible that it will still fluctuate in the range of 2550-2700, and Bitcoin will fluctuate in the range of 59000-61500.
If you like to do Bitcoin and Ethereum, please pay attention. There are no detailed guidance posts every day. Hurry up. BTC daily line is still bullish, so the general direction of operation is mainly low-to-long.


杨锋锋哥
--
Bullish
Analysis of ETH BTC market on August 22, layout in advance, Bitcoin daily line is bullish!
The post posted the day before yesterday made a big profit, with a return of 200%, and you can also directly cash in, so there was news yesterday to wait and see. At 2:00 am last night, the annual reserve released the minutes of the meeting, which roughly meant that there was a high possibility of a rate cut next month, which was good for cryptocurrencies, so after the news was announced at 2:00 am yesterday, it pulled up.
The unemployment benefits were announced at 8:30 pm this evening, which was also a news that affected the market. If it was higher than expected, it was bad news, so the market adjusted downward at night. There will be one or two news that affect the market every week, but after the impact, it will return to technical indicators.
The BTC trend chart is shown in Figure 1: The general direction of the Bitcoin trend chart is relatively accurate and clear. It can be seen from the picture that the market is constantly moving upward from bottom to top. In combination with the Bitcoin daily line, Bitcoin can be bought on dips. The intersection of the trend line below happens to be the Fibonacci support level of 59,600, so it is more appropriate to arrange long orders at this position.
The ETH trend chart is shown in Figure 2: As for the Ethereum market, the current trend chart is consistent with the big cake. The general direction is bullish and buy on dips. The Ethereum Fibonacci support level is 2536-2586. 2586 happens to be the bottom of the trend chart and is also a long position. At present, the indicators are mainly Bitcoin. The indicators of Ethereum are not obvious. At present, the 4-hour KDJ is opening downward, and MACD is also downward. The technical indicators are currently in a state of shock and are not obvious. Combined with the trend chart, it is more appropriate to buy on dips.
ETH evening strategy: go long on the pullback near 2580-2590, target near 2660, and push upward near 2690. Detailed guidance will be posted soon as it is not available every day.
See original
Analysis of ETH BTC market on August 22, layout in advance, Bitcoin daily line is bullish!
The post posted the day before yesterday made a big profit, with a return of 200%, and you can also directly cash in, so there was news yesterday to wait and see. At 2:00 am last night, the annual reserve released the minutes of the meeting, which roughly meant that there was a high possibility of a rate cut next month, which was good for cryptocurrencies, so after the news was announced at 2:00 am yesterday, it pulled up.
The unemployment benefits were announced at 8:30 pm this evening, which was also a news that affected the market. If it was higher than expected, it was bad news, so the market adjusted downward at night. There will be one or two news that affect the market every week, but after the impact, it will return to technical indicators.
The BTC trend chart is shown in Figure 1: The general direction of the Bitcoin trend chart is relatively accurate and clear. It can be seen from the picture that the market is constantly moving upward from bottom to top. In combination with the Bitcoin daily line, Bitcoin can be bought on dips. The intersection of the trend line below happens to be the Fibonacci support level of 59,600, so it is more appropriate to arrange long orders at this position.
The ETH trend chart is shown in Figure 2: As for the Ethereum market, the current trend chart is consistent with the big cake. The general direction is bullish and buy on dips. The Ethereum Fibonacci support level is 2536-2586. 2586 happens to be the bottom of the trend chart and is also a long position. At present, the indicators are mainly Bitcoin. The indicators of Ethereum are not obvious. At present, the 4-hour KDJ is opening downward, and MACD is also downward. The technical indicators are currently in a state of shock and are not obvious. Combined with the trend chart, it is more appropriate to buy on dips.
ETH evening strategy: go long on the pullback near 2580-2590, target near 2660, and push upward near 2690. Detailed guidance will be posted soon as it is not available every day.
The post posted the day before yesterday made a big profit, with a return of 200%, and you can also directly cash in, so there was news yesterday to wait and see. At 2:00 am last night, the annual reserve released the minutes of the meeting, which roughly meant that there was a high possibility of a rate cut next month, which was good for cryptocurrencies, so after the news was announced at 2:00 am yesterday, it pulled up.
The unemployment benefits were announced at 8:30 pm this evening, which was also a news that affected the market. If it was higher than expected, it was bad news, so the market adjusted downward at night. There will be one or two news that affect the market every week, but after the impact, it will return to technical indicators.
The BTC trend chart is shown in Figure 1: The general direction of the Bitcoin trend chart is relatively accurate and clear. It can be seen from the picture that the market is constantly moving upward from bottom to top. In combination with the Bitcoin daily line, Bitcoin can be bought on dips. The intersection of the trend line below happens to be the Fibonacci support level of 59,600, so it is more appropriate to arrange long orders at this position.
The ETH trend chart is shown in Figure 2: As for the Ethereum market, the current trend chart is consistent with the big cake. The general direction is bullish and buy on dips. The Ethereum Fibonacci support level is 2536-2586. 2586 happens to be the bottom of the trend chart and is also a long position. At present, the indicators are mainly Bitcoin. The indicators of Ethereum are not obvious. At present, the 4-hour KDJ is opening downward, and MACD is also downward. The technical indicators are currently in a state of shock and are not obvious. Combined with the trend chart, it is more appropriate to buy on dips.
ETH evening strategy: go long on the pullback near 2580-2590, target near 2660, and push upward near 2690. Detailed guidance will be posted soon as it is not available every day.


See original
Analysis of BTC ETH market on August 20, layout in advance, the volatile market after the big drop in the evening!
The market fluctuated last night, and the market did not come out. The market just started this morning. The market did not come out of the volatile market. I will reply to those who find me and the comment area. Remember to pay attention! The market also rushed up one step, and then the downward market was consistent with the general direction.
BTC 4-hour technical indicators are shown in the figure: Focus on the analysis of Bitcoin 4-hour technical indicators. The ether indicators were also opposite last night, so it was oscillating around 2600 last night. Because the indicators are not unified, it takes time to consume the oscillation. At present, Bitcoin KDJ has just crossed downward, and MACD has just completed the top back structure, which is completely different from Ethereum. Bitcoin's upper pressure is 61,000, and the lower support is 58,400. Today, it just hit this position and rebounded very accurately. Basically, for 10 consecutive days, it has been in this range and has been pulled back near 61,000 above, so this position is a good position for shorting.
ETH 4-hour technical indicators are shown in Figure 2: KDJ crosses downward with a relatively large amplitude, and there are slight upward traces indicating a small rebound. The upper maximum pressure is 2650, and the lower minimum support is 2491. Like Bitcoin, you can short when the upper pressure is near. Tonight's volatile market is mainly high and empty.
ETH evening strategy: short near the rebound of 2590-2600, the target is near 2500, and the downward pin is near 2490. Detailed guidance is urgent!


Explore the latest crypto news
⚡️ Be a part of the latests discussions in crypto
💬 Interact with your favorite creators
👍 Enjoy content that interests you
Email / Phone number
Trending Topics
HMSTRonBinance
2.2M views
1,563 Posts
$PEPE
🚀 Pepe Coin Prediction for September 27, 2024 🚀
Get ready, Pepe Coin ($PEPE) holders! 📈 Based on recent market analysis, Pepe Coin is expected to surge, reaching a target price of $0.00001116 by September 27, 2024. 🐸 This marks a significant rise from its current value, reflecting strong bullish sentiment in the market.
🔍 Key Factors to Watch:
Positive sentiment around meme coins and altcoins in the broader crypto market.
Increased trading volumes as Pepe Coin continues to trend.
Market support from strong communities driving the coin's growth.
🌟 Why Buy Now? 🌟 With momentum building and Pepe Coin looking poised for growth, now could be the perfect time to enter the market. As always, keep an eye on market trends and manage your risk effectively. 💡
📊 Pepe Coin's Predicted Path:
Current Price: 📉 $0.000008 (Approx.)
Target Price: 🟢 $0.00001116 (Predicted by September 27, 2024)
Stay ahead of the trend and make your move! 💰💥
$PEPE
#HMSTRonBinance #BinanceLaunchpoolHMSTR #CATIonBinance
Crypto Universe official
73 Likes
31.1k views
BinanceLaunchpoolHMSTR
79.9M views
28,010 Posts
SpotGoldATH
0 views
0 Posts


