

Preface
In the cryptocurrency market, the flow and operation of funds often become important indicators of price trends. As a well-known market maker, Cumberland's asset transfer direction usually has strong significance for the market. By observing Cumberland's asset flow, we can identify potential price change opportunities and better seize the timing for buying or selling.
Generally speaking, when Cumberland withdraws a large amount of USDT, this action is interpreted as a buying signal, as it often indicates that funds are about to enter the market, potentially driving the price up. Such transfer behavior reflects Cumberland's market dynamics.
However, when Cumberland transfers ETH into Binance, the situation is completely different and is usually regarded as a selling signal. This operation may imply that Cumberland is preparing to sell ETH, which could lead to a price decline in the market. By observing these key flow changes, we can more accurately grasp market trends and make corresponding operations at the appropriate time.
Cumberland's fund transfer routes

The chart shows Cumberland withdrawing USDT from the Tether Treasury and transferring ETH to Binance.
From the above chart, it can be concluded that Cumberland's operational path is as follows:
Cumberland's withdrawal of USDT and subsequent transfer to Binance represents fund inflow to Binance exchange for buying ETH (green).
Subsequently, ETH was withdrawn from Binance (yellow), and finally, during the upward process, it was transferred back to Binance at the corresponding high points for selling (red).
Cumberland's transfer timing of ETH and price behavior

The above chart shows the route of Cumberland withdrawing USDT from the Tether Treasury and transferring ETH to Binance.

The above chart shows the time in March when Cumberland transferred ETH to Binance, the amount transferred, and the change in ETH price after the transfer.
The selling period from 2024/03/14 to 2024/03/20 can be considered as a top escape. At that time, 2024/03/13 was the Ethereum Cancun upgrade, and after the upgrade, Cumberland chose to sell and fell back 23% from the high point.

The above chart shows the time when Cumberland transferred ETH to Binance from 2024/04/08 to 2024/04/29.

The above chart shows the time in April when Cumberland transferred ETH to Binance, the amount transferred, and the change in ETH price after the transfer.
During the period of 2024/04/08, selling 1,500 ETH led to a 15.58% decline in ETH price. One reason for the decline was BTC breaking new highs and approaching the Bitcoin halving date. Cumberland may have reduced its ETH holdings to lower risk.

The above chart shows the time when Cumberland transferred ETH to Binance from 2024/05/01 to 2024/05/30.

The above chart shows the time in May when Cumberland transferred ETH to Binance, the amount transferred, and the change in ETH price after the transfer.

The above chart shows the time when Cumberland transferred ETH to Binance from 2024/06/03 to 2024/06/06.

The above chart shows the time in June when Cumberland transferred ETH to Binance, the amount transferred, and the change in ETH price after the transfer.

The above chart shows the time when Cumberland transferred ETH to Binance from 2024/07/22 to 2024/07/29.

The above chart shows the time in July when Cumberland transferred ETH to Binance, the amount transferred, and the change in ETH price after the transfer.
2024/07/23 is the date of ETH spot ETF release. On the eve of the release, on 2024/07/22, Cumberland preemptively transferred 7,150 ETH to Binance, and the price subsequently fell by 11.75%.

The above chart shows the time when Cumberland transferred ETH to Binance from 2024/08/05 to 2024/08/26.

The above chart shows the time in August when Cumberland transferred ETH to Binance, the amount transferred, and the change in ETH price after the transfer.

The above chart shows the time when Cumberland transferred ETH to Binance on 2024/09/05.

The above chart shows the time in September when Cumberland transferred ETH to Binance, the amount transferred, and the change in ETH price after the transfer.

The above chart shows the time when Cumberland transferred ETH to Binance from 2024/10/01 to 2024/10/16.
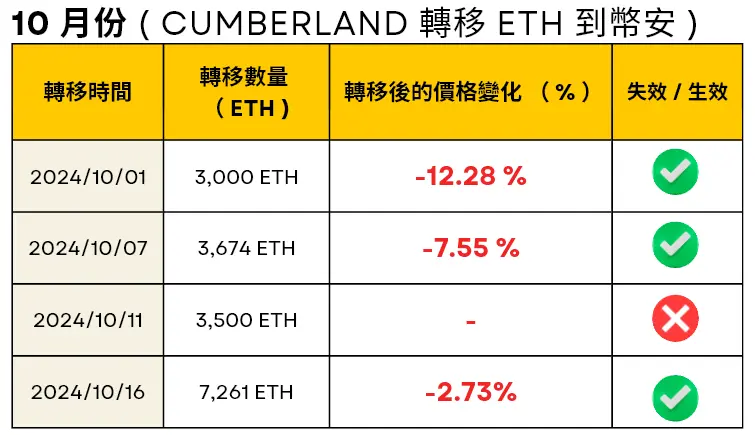
The above chart shows the time in March when Cumberland transferred ETH to Binance, the amount transferred, and the change in ETH price after the transfer.
Related links
Summary
After summarizing, the performance of Cumberland transferring ETH to Binance from March 2024 to October 2024 is as follows:
The probability of causing a price decline is 75%.
There were a total of 28 transfers of ETH to Binance, 21 of which were effective and led to price declines, while 7 were ineffective.
The average value of price drop % is 12.36 %
It can be seen that we can use Cumberland as an on-chain indicator, taking Cumberland's withdrawal of USDT as a buying condition and Cumberland's transfer of ETH as a selling condition. Reviewing past history, during favorable or significant events, Cumberland has been able to sell in advance to escape the top.
Bitcoin halving (down 15.58%)
Ethereum upgrade (down 23.80%)
Ethereum spot ETF (down 11.75%)
With the US election on 2024/11/05, will Cumberland be able to escape the top again? The author will watch with everyone.
Dear readers, you may be wondering: 'Where can I learn and see these in-depth analytical methods and valuable data sharing?'
Click the link below to learn together!
https://da.studio/


