Support and resistance levels are commonly used to judge market trends and are an important method of technical analysis. However, we cannot visually see the support and resistance levels on the candlestick chart, so we need to draw lines to assist in analysis.
1. What is a support position
When the price of the coin undergoes one or several rounds of decline and reaches a certain price level, buyers take this opportunity to buy at a low price, resulting in an increase in buying and a decrease in selling, causing the price of the coin to stabilize after the decline.
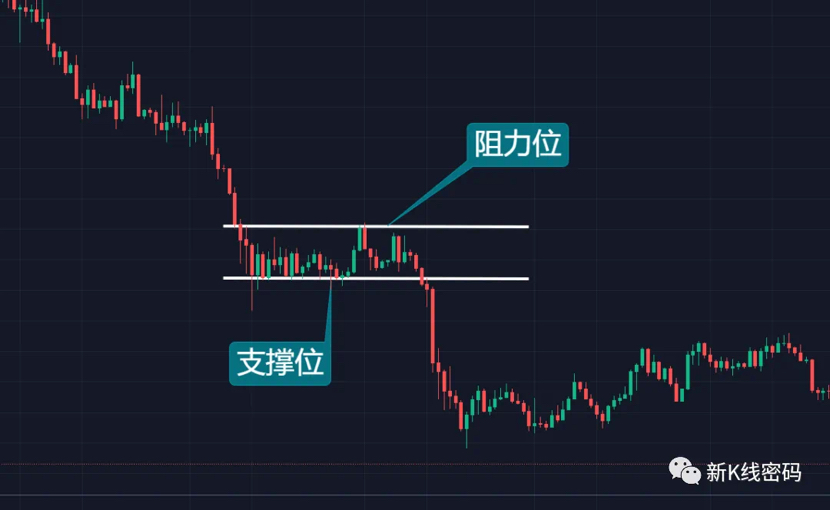
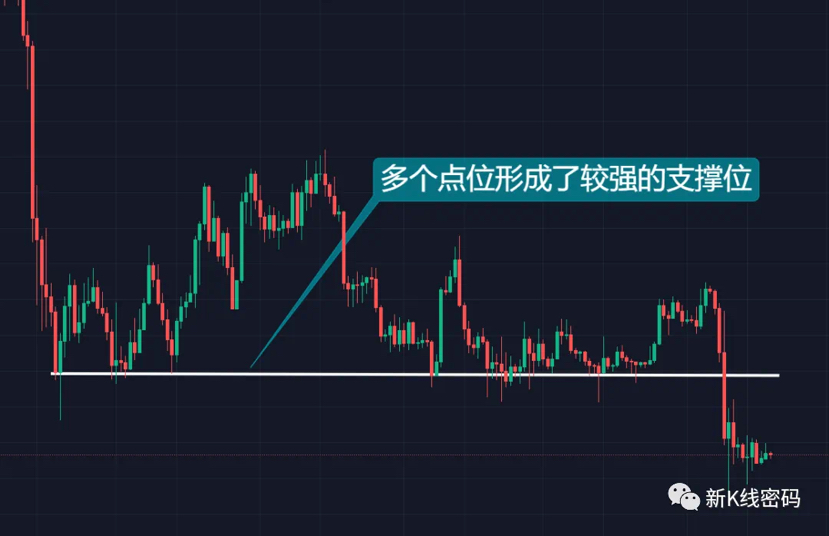 In simple terms, the support level refers to a point that prevents the price of the coin from continuing to fall. The market may continue to consolidate or may start to rebound.
2. What is a resistance level
When the price of the coin falls below a dense trading area, a large number of trapped positions will be created. Once the price stops falling and starts to rise, these traders will have the intention to sell to break even, and a large amount of selling will create some resistance to the price increase.

The resistance level is the tangent line connecting the highest points of each peak in the candlestick chart, which serves to prevent the price from continuing to rise. In other words, when the price of the coin rises near the resistance level, the price will stop rising or even retreat.
3. The conversion between support and resistance levels
Support and resistance levels can be interchangeable.
After the price of the coin effectively breaks through upwards, the upper resistance level will form our support level.
 Similarly, when the support level is broken down, this support level will also become a resistance level in the future.