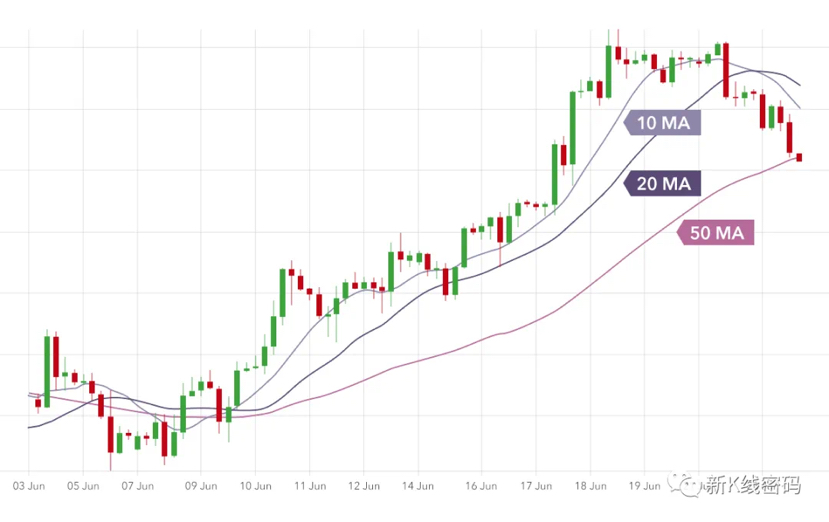
Generally speaking, in an upward trend, shorter-period or steeper moving averages will remain above longer-period or flatter moving averages. It is not hard to imagine that this is because flatter moving averages have a longer reaction time to trends. For example, in the figure below, during an upward trend, the 10-day moving average is at the top, followed by the 20-day moving average, and then the 50-day moving average below it.
 In a downward trend, reversals are generally valid, as shown in the figure below, where the 50-day exponential moving average is at the top, followed by the 20-day exponential moving average, and then the 10-day exponential moving average below it:
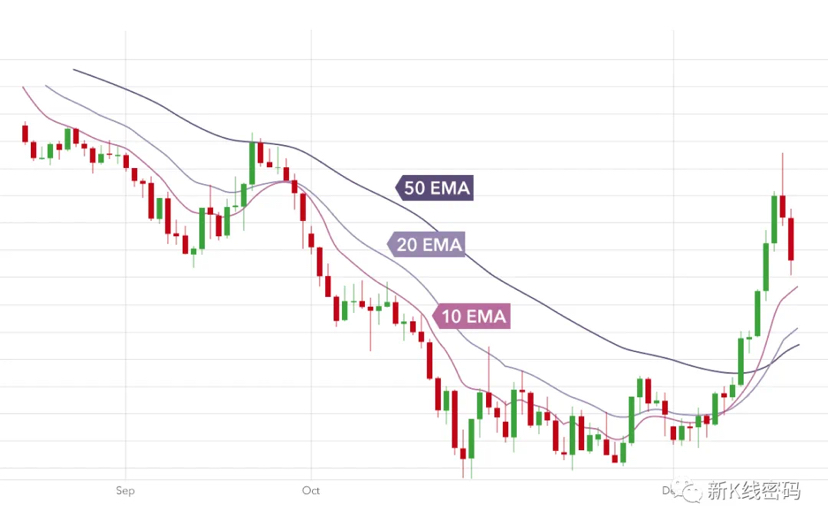 Note how the 20-day exponential moving average and the 10-day exponential moving average are tangent in the trend, so this method, like all technical analysis, is by no means foolproof. However, combining it with other techniques such as trend lines and channels can be an effective way to gauge the market's general direction.
Moving average crossover
Let's return to Figure 1, but this time remove the 50-day moving average:
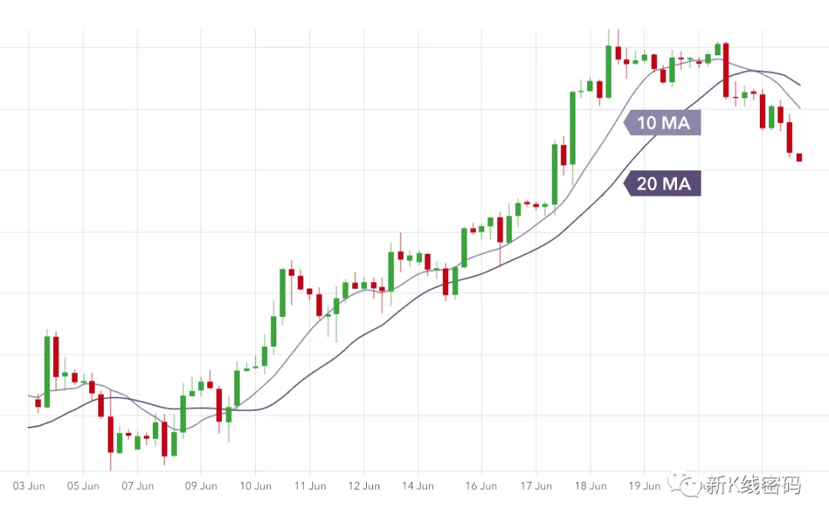 As shown in the figure, the 10-day moving average is typically above the 20-day moving average in an upward trend, but below it in a downward trend. Therefore, the crossover points of moving averages may be excellent positions to enter/exit trades. Generally, when the shorter-term moving average crosses above the longer-term moving average, it is suitable for going long; when the longer-term moving average crosses above the shorter-term moving average, it is suitable for reversing positions.
If you apply this strategy to the upward trend mentioned above, you would go long at the moving average crossover and then exit the trade when the moving averages cross again, resulting in substantial profits.
Please note that this method should only be used when the market is in a strong upward or downward trend. If the market is in a consolidation or sideways phase, you are likely to observe a large number of crossover signals, which are not favorable trading opportunities.
Moving averages are used as support and resistance levels.
Like trend lines or channels, moving averages can serve as dynamic support and resistance levels, and you do not have to draw them yourself. Let's review Figure 2, this time only adding the 10-day exponential moving average.
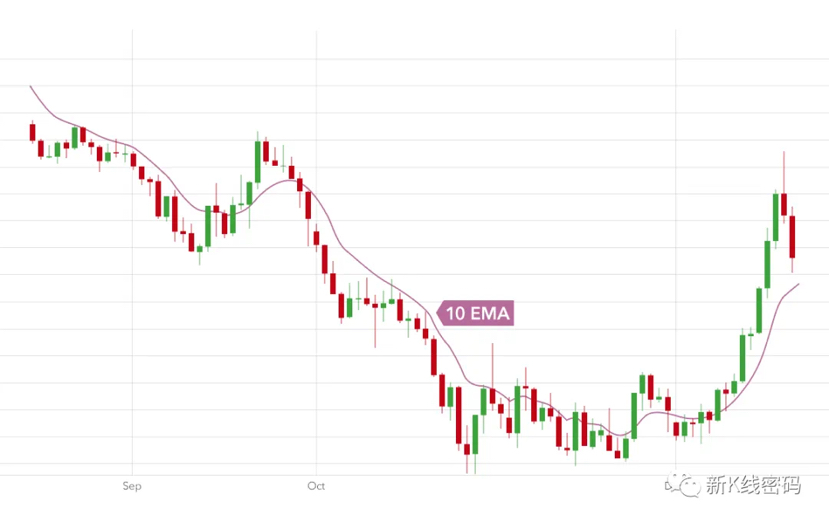 As shown in the figure, the 10-day exponential moving average resistance level holds down the downward trend most of the time. However, there was a point where the price significantly broke above this average. It turned out to be a false breakout, and the downward trend continued.
For this reason, many traders add multiple moving averages to their charts. If we also include the 50-day exponential moving average, it can be seen that although the 10-day moving average was broken, the 50-day moving average still held during a brief rebound.
 At the end of the consolidation period, just before the market turns to an upward trend, adding the 50-day exponential moving average also releases strong crossover signals.