Analysis of ETH market on September 6, layout in advance, the trend chart is still mainly high and empty as yesterday!
The trend chart of Ethereum is still the same as yesterday, the general direction remains unchanged and mainly high and empty. The profits of those who followed the posts I read yesterday and found me for consultation or left messages were not bad. The upper pressure of Ethereum is at 2417, so as long as this position does not break through, it is still close to this position to short. Yesterday and today, there were four times of shorting near 2410, and those who followed can take the profit.
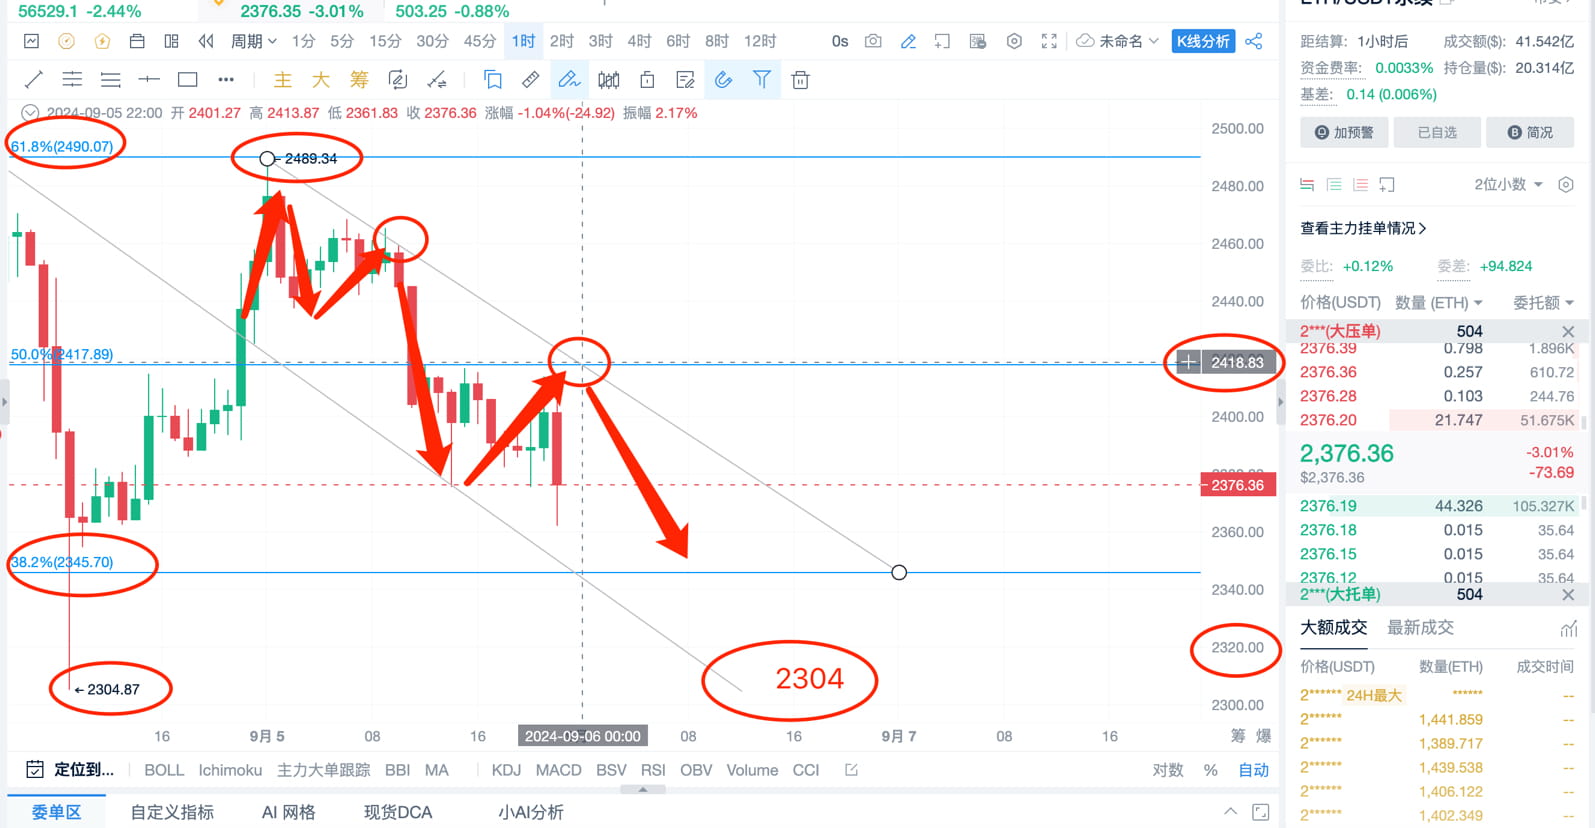
Focus on translating. I drew a daily trend chart two days ago, which is very accurate. After looking at the trend chart, you will feel very surprised that it is too accurate. The trend chart of the daily line is basically under pressure and rebounded. The position is constantly moving downward, so the high point is constantly moving downward. Now it has moved to 2490. What does it mean? 2490 is the current highest point, which is difficult to break through unless there is major news. Therefore, it is safer to short at 2400, because the highest increase is only a few dozen points.
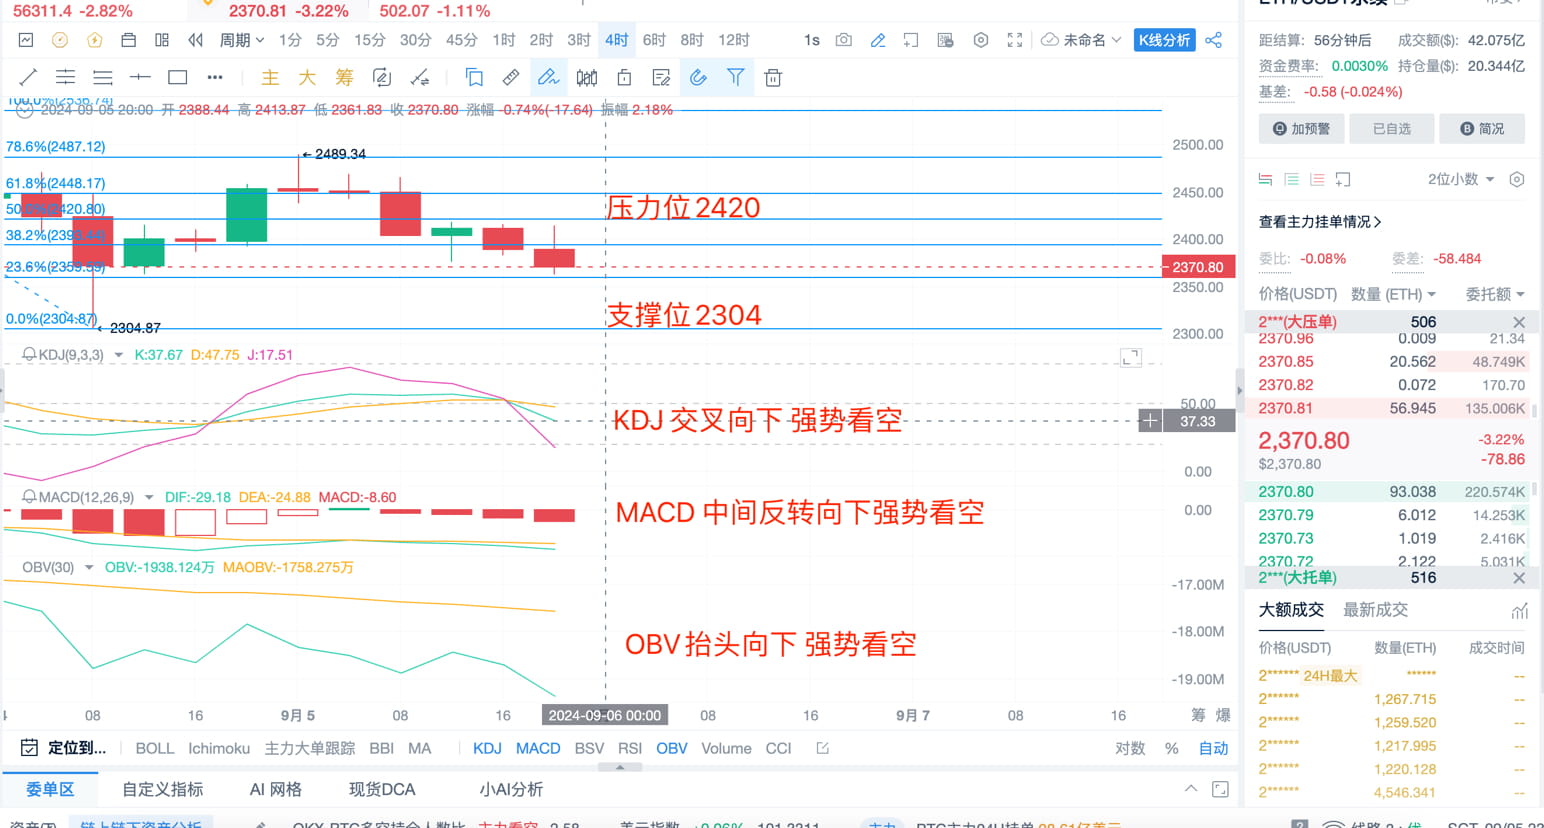
ETH 4-hour technical indicators: You can open KDJ and see that it has crossed downward, indicating that the crossover is strongly bearish. The lower support of Ethereum is 2345, which is why it fell to around 2345 tonight and rebounded, and then it will fall back to around 2400. If 2435 is not stable, it will break through directly and continue to look at 2300. Tomorrow is the weekend market again.
ETH: The strategy is still to short near 2400, and the lowest level is still around 2300. The operation is mainly high, and detailed guidance is urgent!