When did the Ethereum Foundation sell its shares in the past 5 years?
ETH?
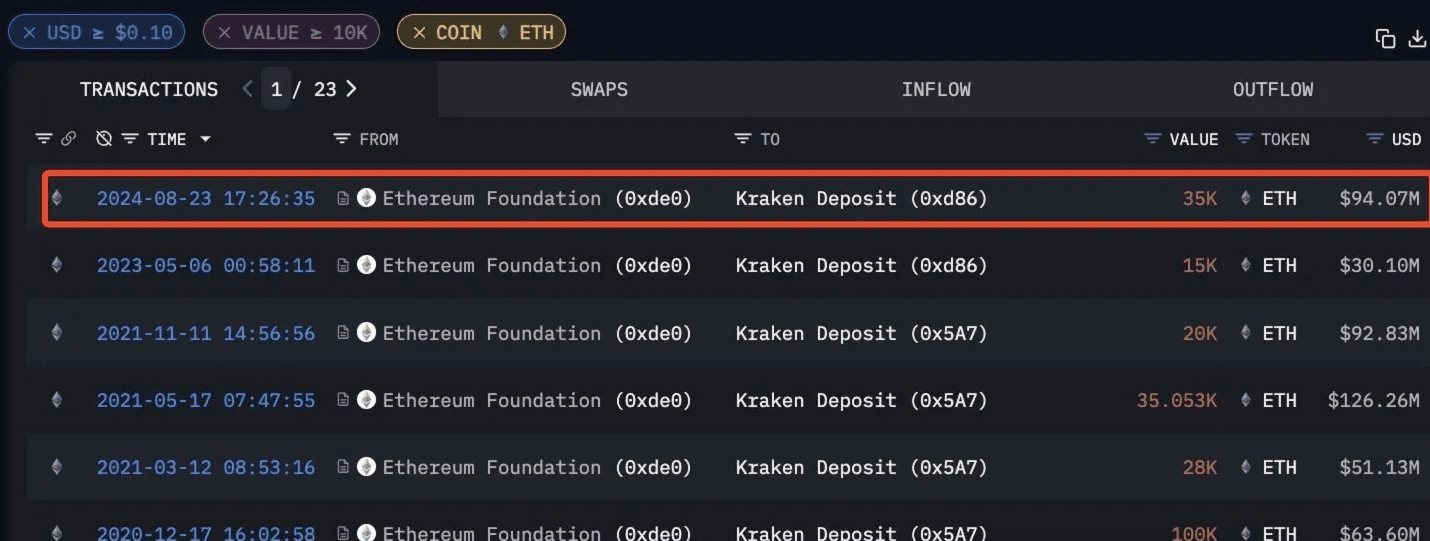
It is well known that the Ethereum Foundation sold the highest prices in May and November 2021. But in 2020, just before ETH rose 6 times, they sold 100,000 ETH.
This time on August 23, they sent another 35K ETH to Krakena, worth $95 million. This was also an important reason for the market to fall on August 28. At most, ETH fell by nearly 6%.
Bitcoin spot ETF transaction and inflow and outflow data:
Institutional holdings: IBIT [BlackRock], FBTC [Fidelity], GBTC [Grayscale], etc. now have a total holding of nearly 1 million BTC.
Inflow and outflow: Bitcoin trading will start on January 10, 2024
Since the spot ETF, there has not been a large-scale selling situation overall, and it is basically buying! Continuous buying, institutions are still optimistic about BTC in the long term.
In fact, this will also expose several problems:
1. As of August 31, 2023 and 2024, BTC has not seen a single-day increase of more than 20%. It can even be said that this has not happened in the past two years? This shows that Bitcoin will become more and more stable, and more and more people will buy it. This data has actually surpassed the vast majority of US stocks.
2. Liquidity will become weaker and weaker, because the intervention of institutions and the circulation of spot ETFs will lead to more people only buying BTC instead of selling.
There will also be institutions that go to the exchange to borrow money and then dump the market to maliciously short sell, but the cost of this round will be very high, and it will be easy to crash the market and not be able to buy it themselves! At the same time, there will also be a situation that during a crazy bull market, the highs may be higher than we usually think.
In the past decade, BTC has been
When did it reach its peak?
163 days after the BTC mining output was halved in 2016, long-term holders of the chain started a bull market and a large distribution of 20 years#BTCmining output was halved 163 days after the chain long-term holders of the chain started a bull market and a large distribution of 20 years
It has been 133 days since the halving of BTC mining output in 24 years. The indicator in the figure is the percentage of the number of chips held by long-term holders on the chain. The red line is the <13-17 years> segment of the indicator; the blue line is the <17-21 years> segment of the indicator; the black line is the <21 years-to-now> segment of the indicator. The three lines align the halving days of BTC mining output in their respective cycles.
Note: The long-term coin holders on the chain refer to BTC that has not been moved on the chain for more than 155 days (the time is calculated from the last movement of BTC on the chain).
In 2015, the green column appeared at the end of the bear market and the beginning of the bull market, and it reached the bull peak 2 years and 50 days later; in 2019, the green column appeared at the end of the bear market and the beginning of the bull market, and it reached the bull peak 2 years and 05 days later;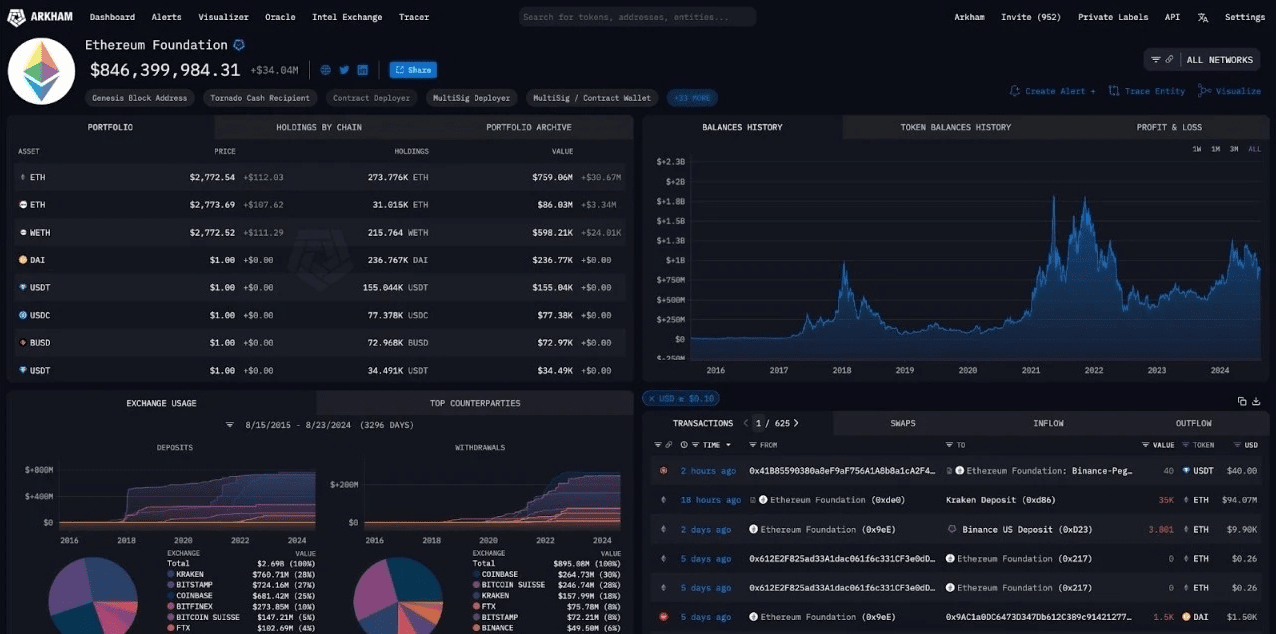
 Green column appears at the end of the 3-year bear market and the beginning of the bull market. Currently, 1 year and 94 days have passed.


