Trend trading is easy to understand, that is, choosing technically strong targets for trading, which can achieve quick profits and increase capital utilization. So, how to judge the trend? Today, let's talk about one of the most basic strategies in quantitative trading: momentum strategy.
————————————————
📍What is a momentum strategy?
When talking about momentum strategy, we have to mention the momentum effect. Momentum effect is also generally called "inertia effect", which means that the stock's return rate has a tendency to continue the original direction of movement, that is, the stock with a higher return rate in the past period of time will still have a higher return rate in the future than the stock with a lower return rate in the past, that is, the strong will always be strong.
The strategy that matches the momentum effect is called the momentum strategy. The momentum strategy is one of the most famous long-term and short-term stock strategies and is widely used. Richard Donchian, the father of trend tracking, trades based on the theory of the momentum effect. He believes that traders should buy assets when asset prices rise and sell assets when they fall, because the price trend of assets is expected to continue. To describe it in one sentence, it is - trading with the trend, going long on an upward trend and short on a downward trend.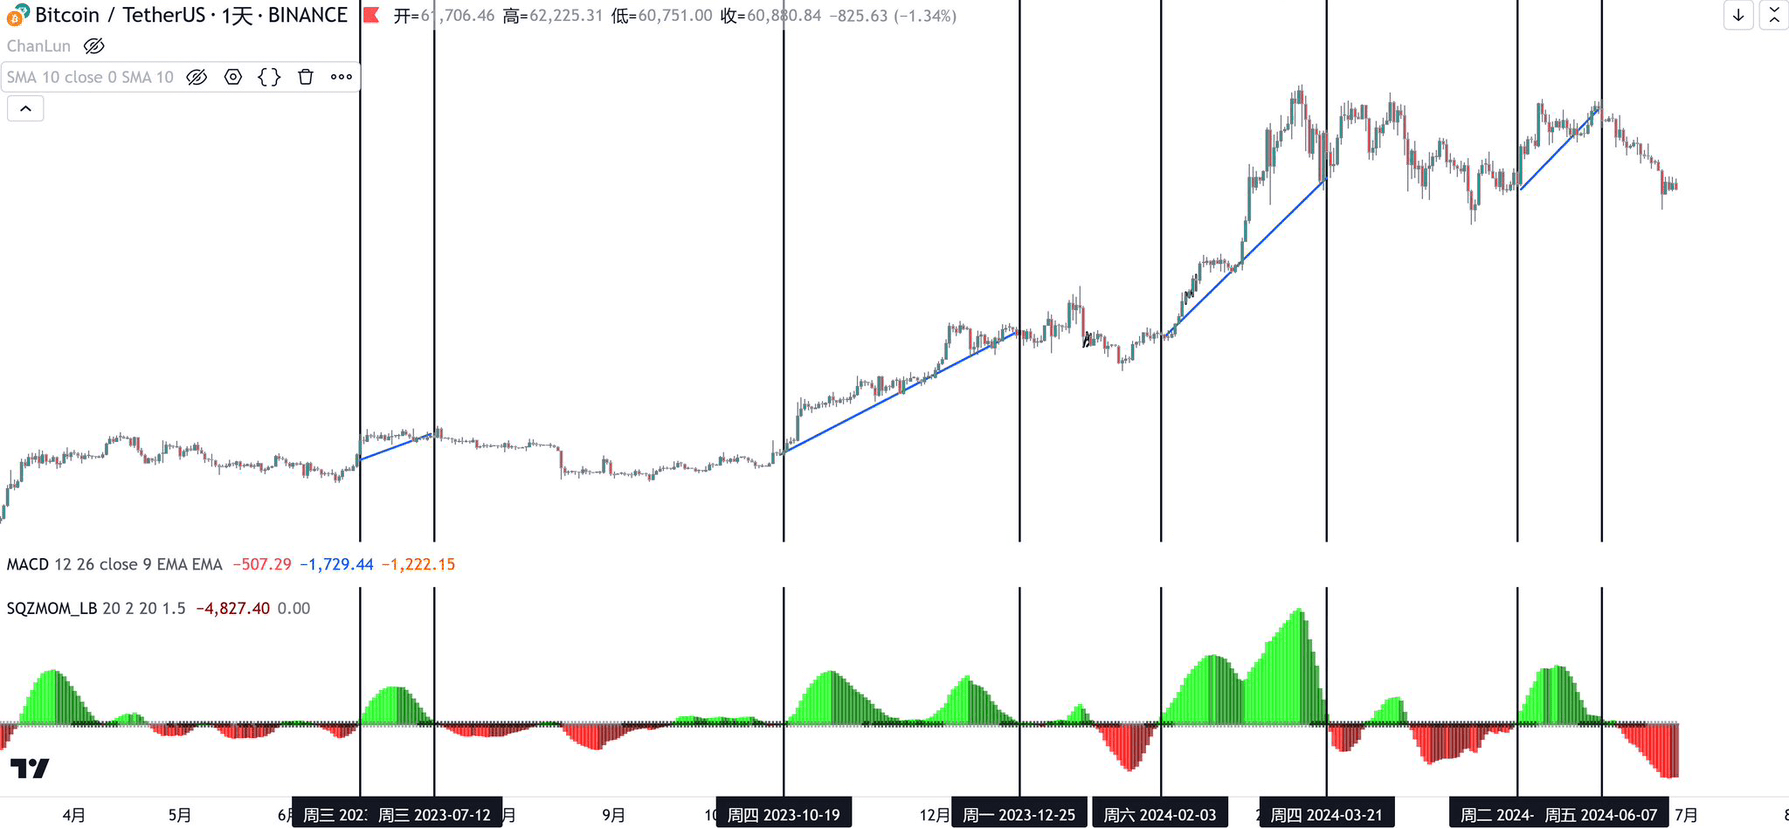
————————————————
📍How to use momentum strategy?
1. Momentum indicators
The inventor of this indicator is the technical trading pioneer, Guy Tre, who proposed a mathematical formula in the 1930s. As a technical analysis indicator, it works by comparing the latest price with the previous price within a specified period. Upward momentum indicates that the upward trend may have enough strength to continue, issuing a buy signal, and vice versa.
There are a lot of open source versions of the momentum indicator on TV. You can search for Momentum Indicator. Below I take BTC as an example and compare the trend of BTC when the momentum indicator rises in the bull market in the past year. You can see that it is not 100% accurate, but it is basically consistent. You can use this as a basis to find coins in a strong trend. The higher the column, the stronger the trend.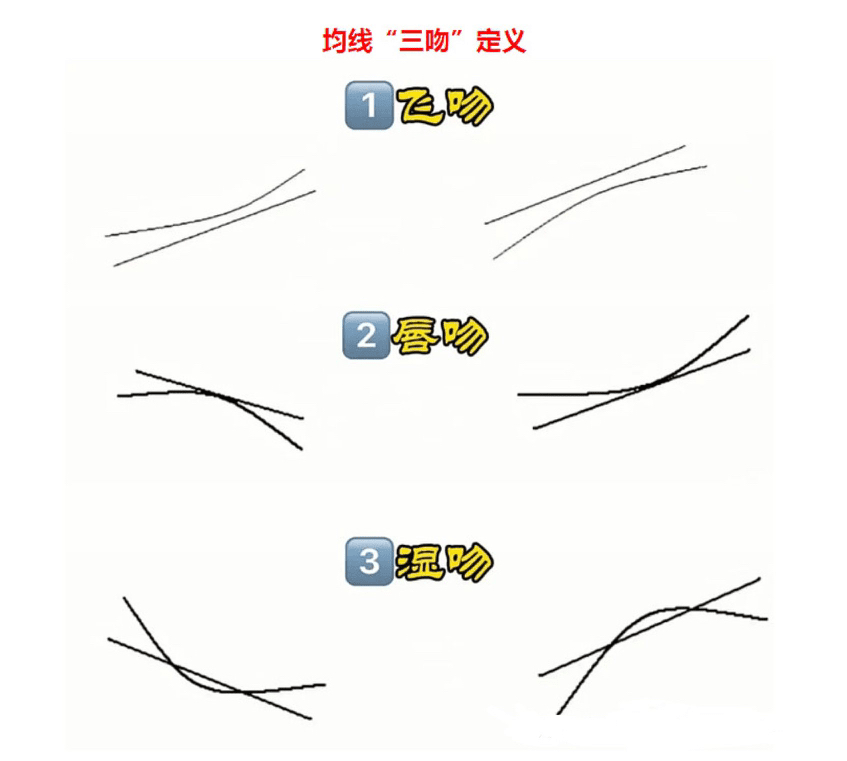
2. Moving Average
Moving average can be used to measure trend direction, which most people use. Among the moving average theories, the most famous is the Gannwei law. I have popularized this before. If you are interested, you can check it out. Vegas channel is also a moving average derivative indicator. These can be used as the basis for judging trend direction and strength, but I personally recommend the Three Kisses Theory of Moving Average of Chaos Theory. The Three Kisses Theory is a simplified version of the Gannwei law and is more practical.
Kiss: The short-term moving average slightly flattens and then continues to follow the original trend
Lip kiss: The short-term moving average approaches the long-term moving average but does not fall below or rise above it, and then continues in the original trend
Wet kiss: the short-term moving average falls below or rises above the long-term moving average, or even appears repeatedly entangled, like glue and paint. There will definitely be an intersection, not necessarily a turning point, but a turning point can only be achieved by a wet kiss.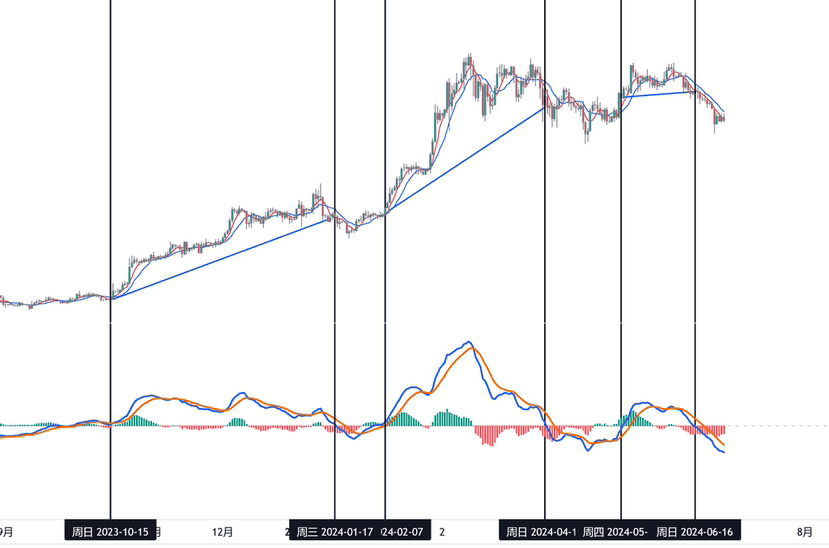
3. MACD
MACD, the king of indicators, has many uses and can be used to judge trends. In the 103rd lesson of the Chaos Theory, it is mentioned in the original text: For the simplest MACD indicator, the 0 axis is divided into long and short dominance. That is to say, once the MACD indicator falls below the 0 axis, it will enter short dominance under the chart of the corresponding time unit, and this must be avoided.
As shown in the figure below, in the recent trend of BTC, there is basically a bullish structure above the zero axis. Of course, its accuracy is not as good as the MI indicator, but it can still be used as a reference for trading direction.
Summarize
The momentum strategy is one of the most basic quantitative strategies. It can be used to select coins, set indicator filters, and only select strong coins. It can also be used as an auxiliary trading indicator. For example, when we want to short, we can choose coins whose high level is below MACD and whose current level is above MACD. This conforms to the trading principle of following the big and going against the small.
There are also a large number of open source quantitative projects on GitHub that use momentum strategies. Students who are interested can study them on their own.


