🔥💰🔥$LINK price prediction analysis from recent data and trend.🔥💰🔥
✅🔥 As displayed in figure-1 chart, The price of $LINK is moving towards the resistance of the descending channel. Need buyers volume to break that resistance, if it fails to break resistance then it may possibly retest the major horizontal support ( support is drawn using fib) zone, from where the reversal trend begins and the price might go upward in the direction.
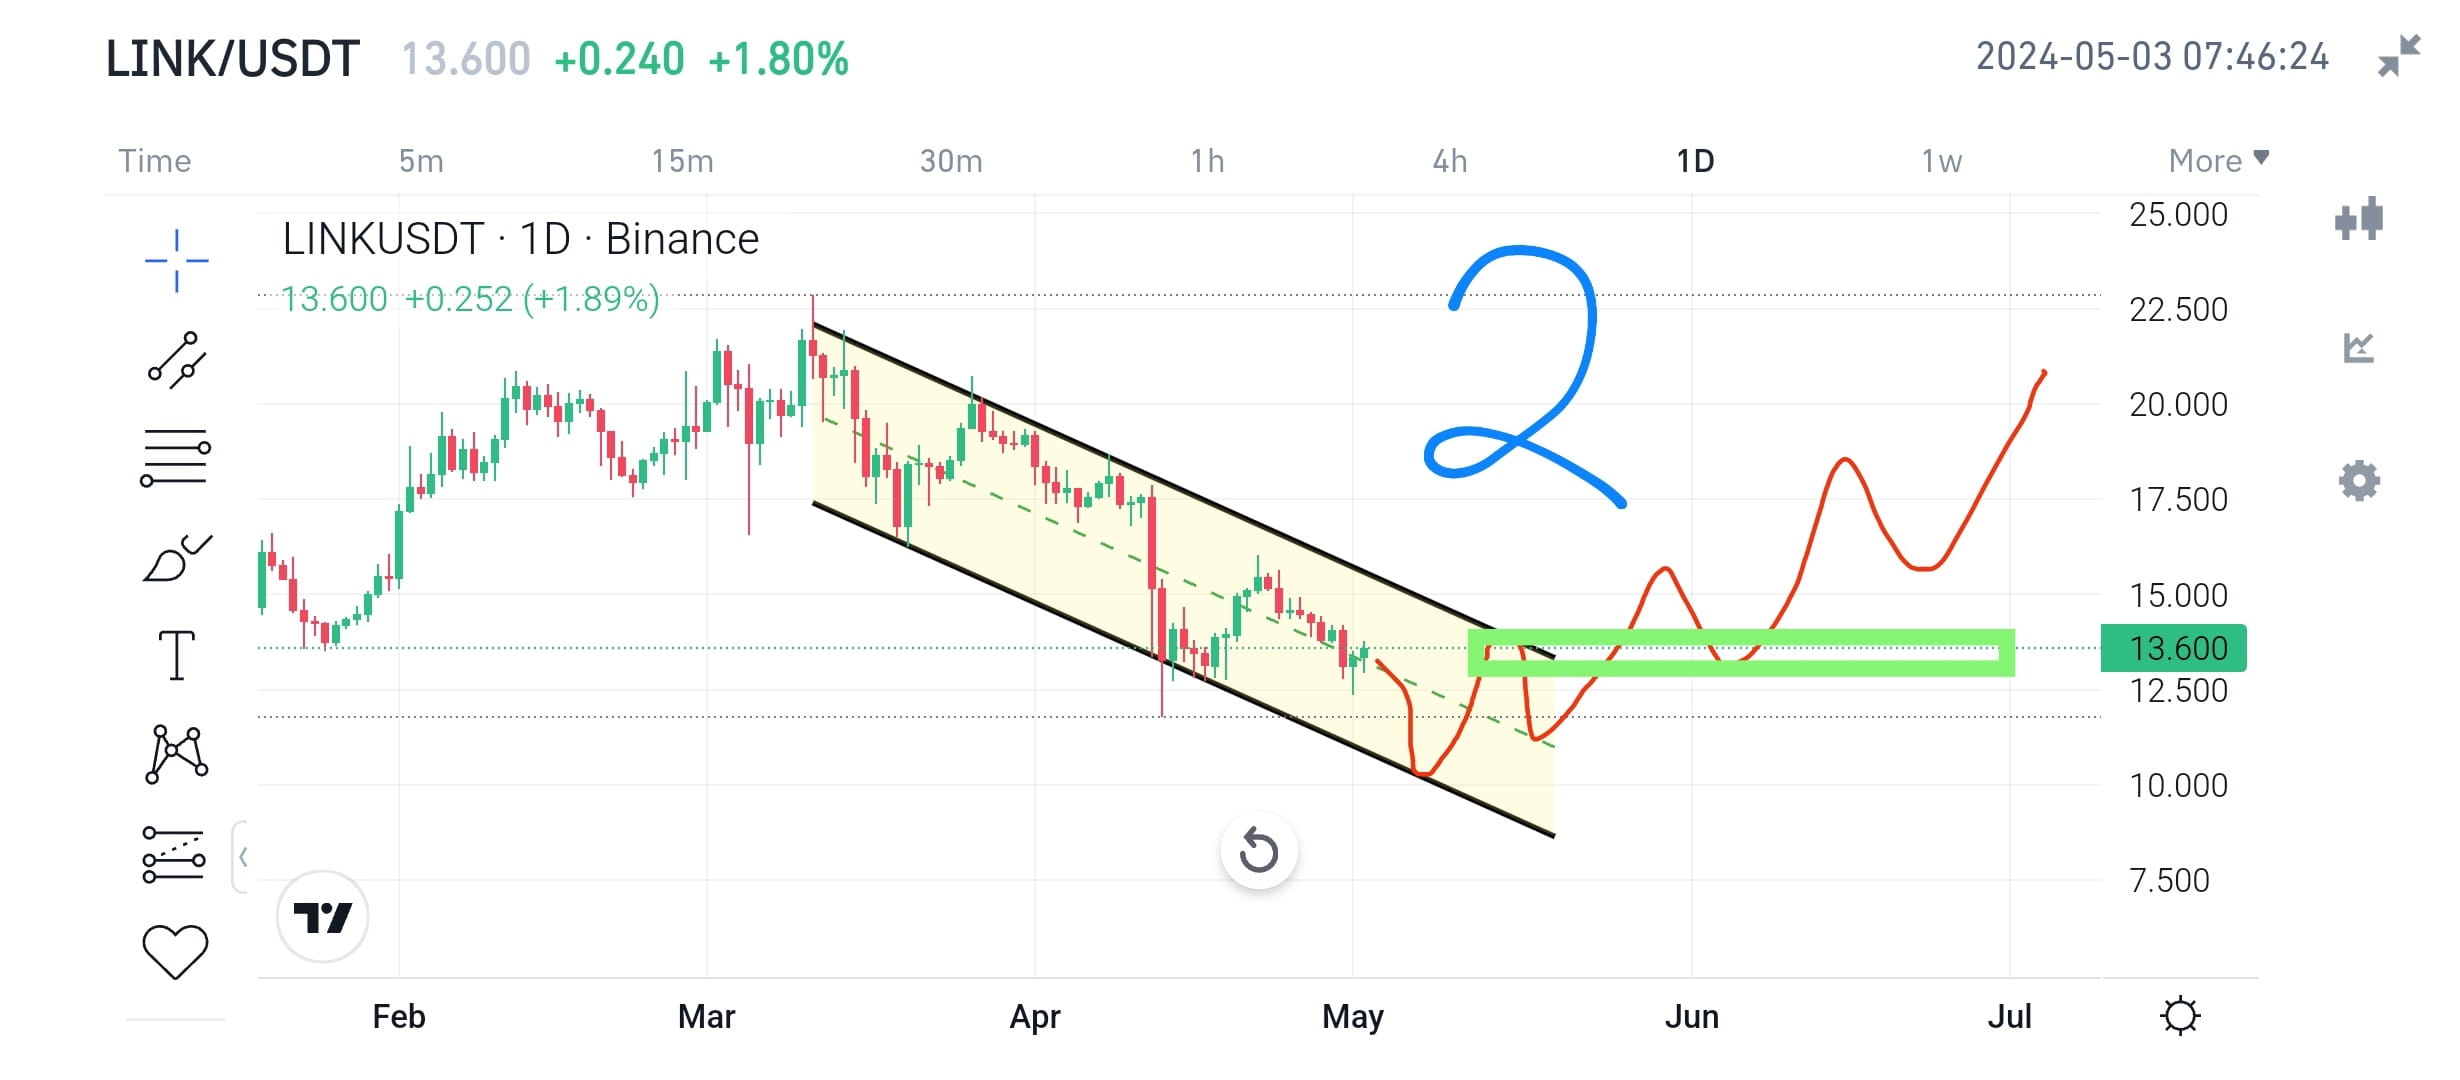
✅🔥 Figure-2 chart displays that if $LINK continue to move in descending channel for some time. By considering current market sentiments Link may possibly fail to hold the current support/central trendline then the price probably dump towards the $9-$11 zone. It may be highly likely that prices will bounce from lower trendline/support and start up trend where it faces major resistance that need to break down to continue upward movement.
✅🔥 Spot buyers probably should do DCA, if they bought at higher price then doing DCA of $LINK around central/lower support is a good idea for long term gain. It is an observation from market trends, social activities and market cap data that LINK will only do 5x-7x during the next leg of the bull market. So far, show some patience and determination for profit.
📝📢PLEASE PRESS FOLLOW if you like and agree with the idea and want more information about other crypto currencies.
🚨DYOR for financial activities. This information is only for learning and education purposes. Thank you.