✅✅Data check and facts for $ETH / $BTC chart. The most important chart in the crypto market.🔥🔥
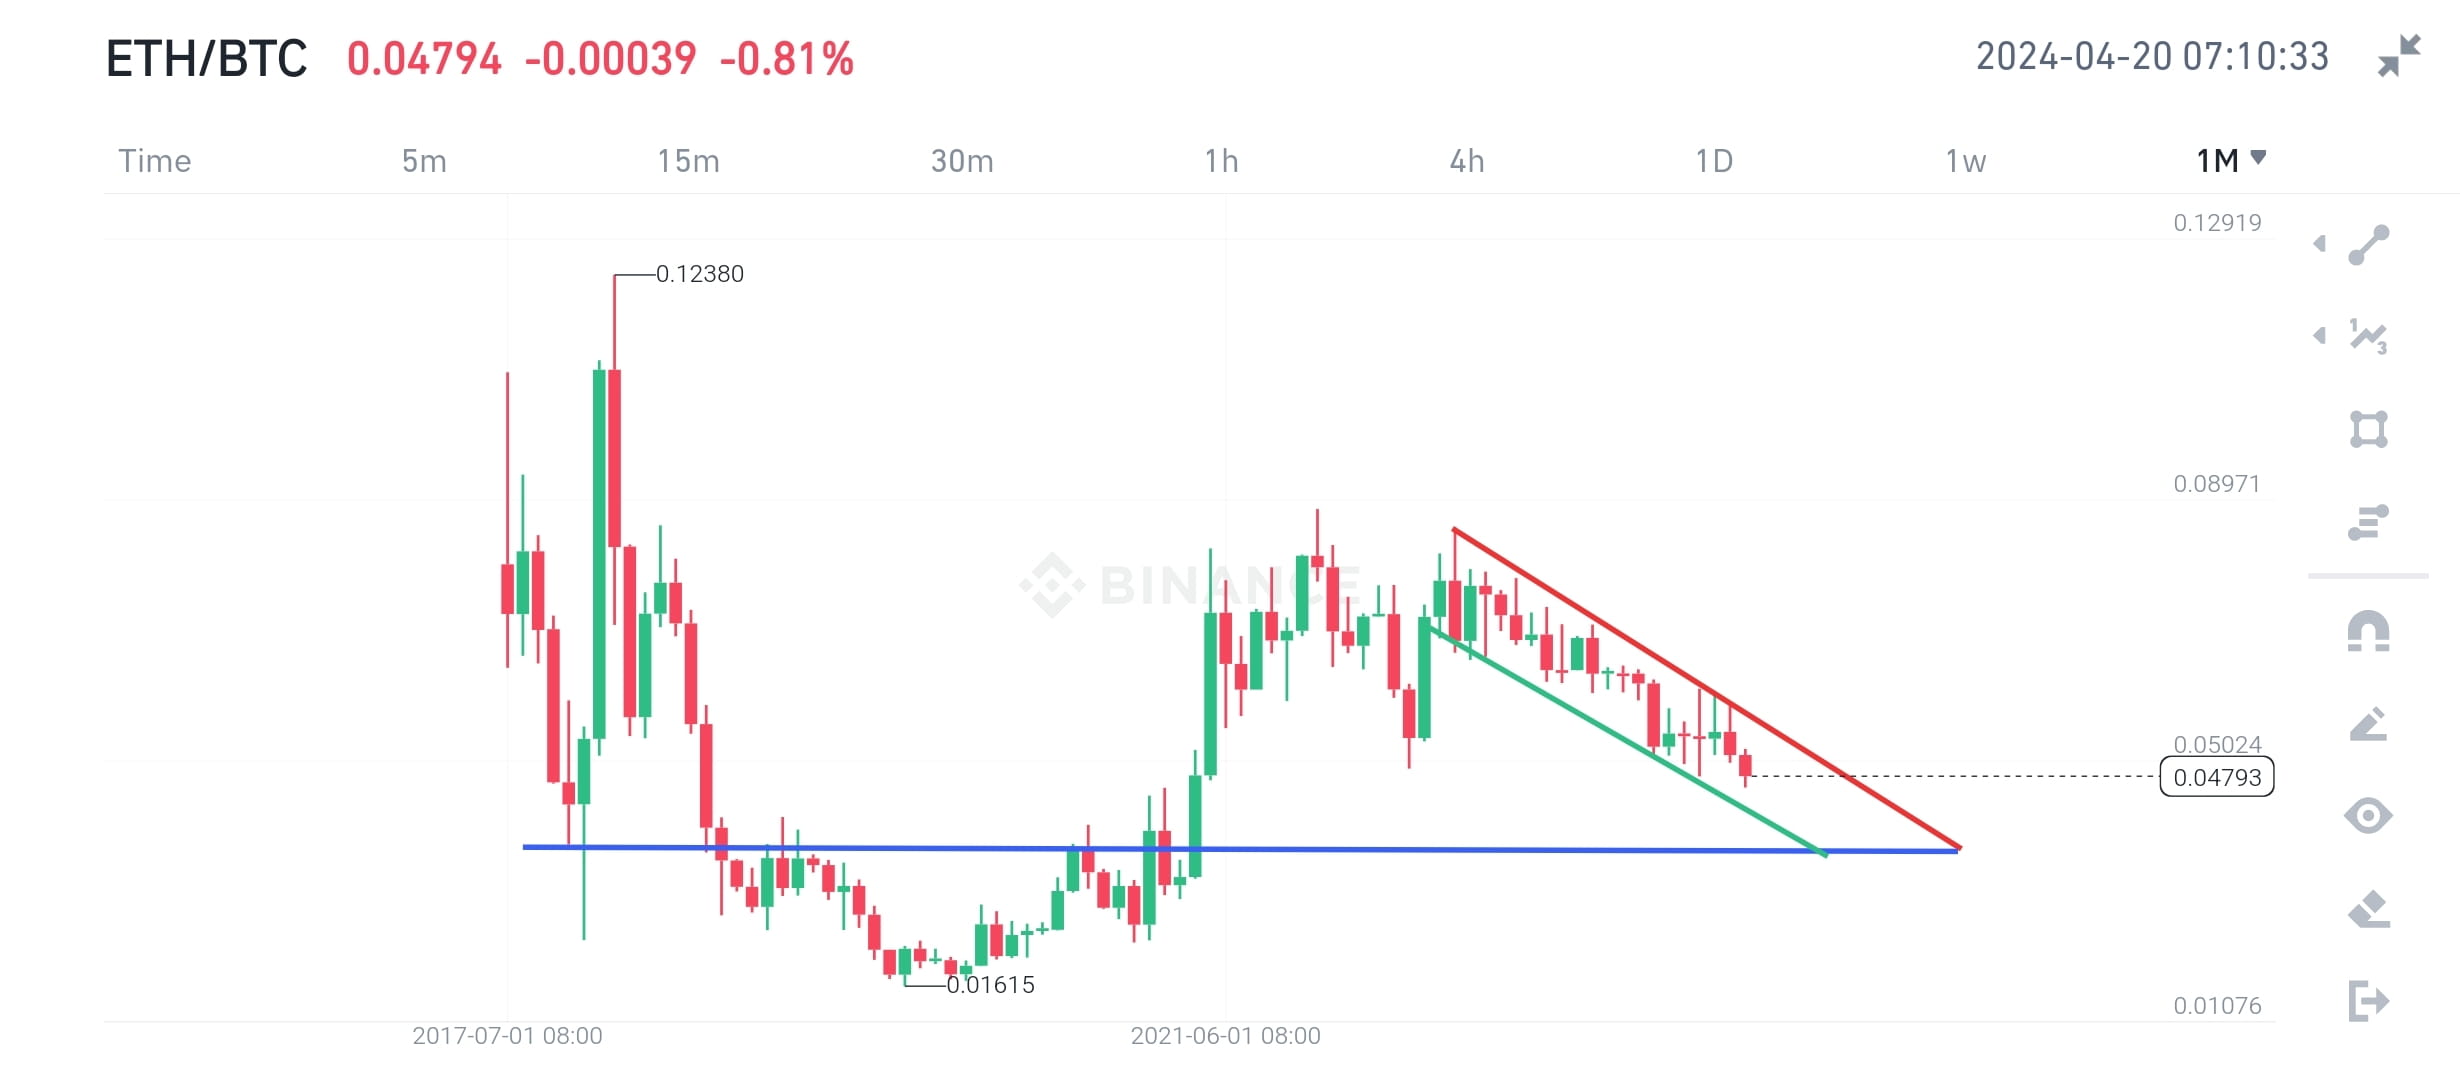
ETH/BTC in a distribution phase similar that happened towards the end of 2021.
The horizontal Blue line is a big support around 0.33-0.43. At present the trend is continuously downward that is moving in a parallel channel line between red and green line. Red acting as a resistance and green as support. ETH/BTC pair moving in this channel for almost 2 years.
Highest valuation of ETH/BTC pair in each quarter .
Q3 2022: 0.086
Q4 2022: 0.079
Q1 2023: 0.078
Q2 2023: 0.071
Q3 2023: 0.065
Q4 2023: 0.063
Q1 2024: 0.061
Q2 2024: 0.052
Q3 2024: 📉📉 or 📈📈??
If eth/btc pair moves in a similar way probably it will land in zone 0.33-0.43. The blue horizontal line is a monthly support line. From the historical data and pattern check the blue line will be bottom for this pair before any reversal. Over the past three years btc has been dominant. Trade carefully and have an eye on this pair. Based on data and fact checks during btchalving $BTC initially crash or high volatility (5-10k down/up) then recover back around 1-3 months.
Please press follow for important chart knowledge and updates about the market.
DYOR for financial activities as this information is for learning and education purposes. Thank you.