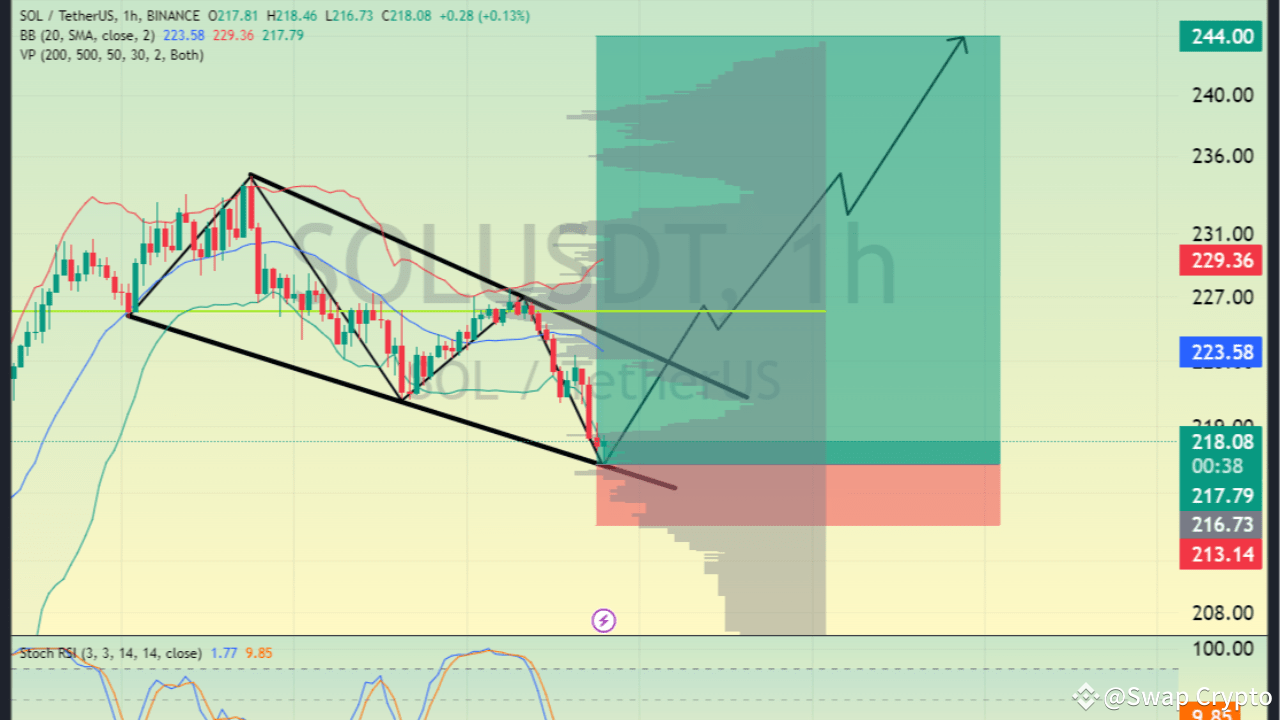
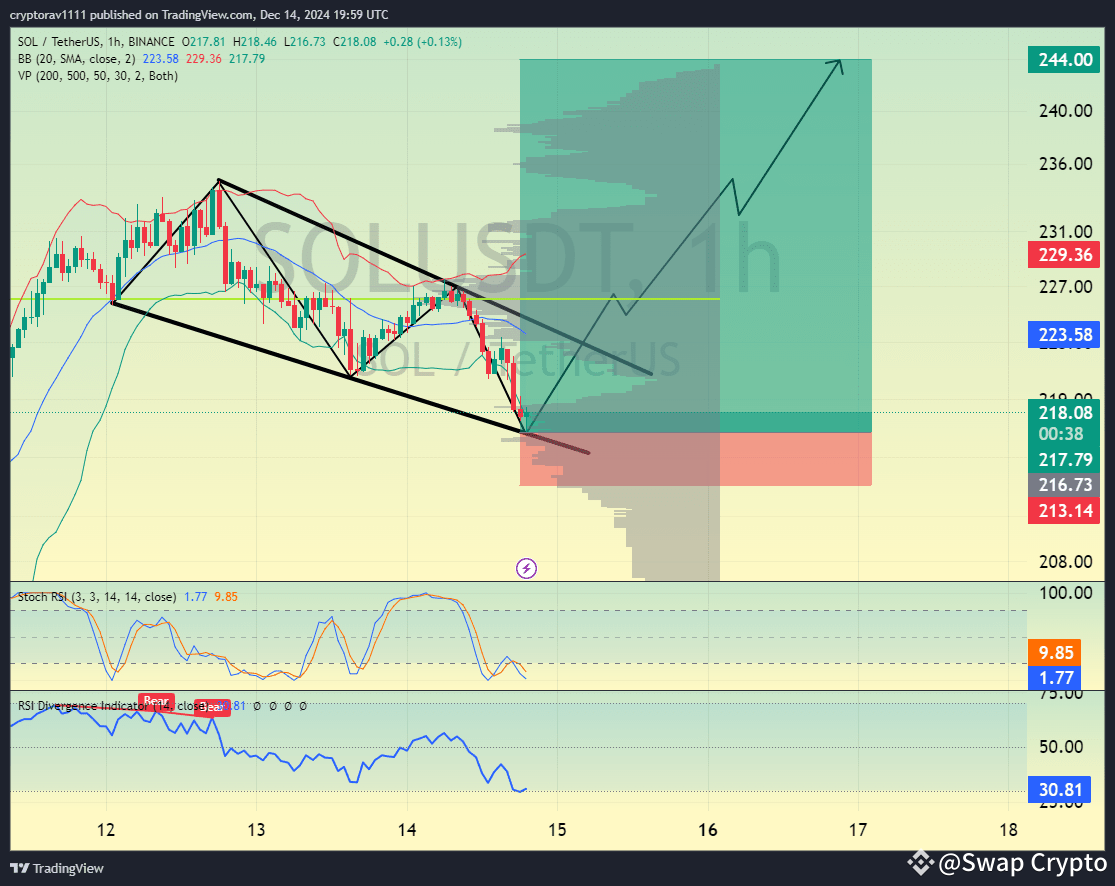
The SOL/USDT chart displays a falling wedge pattern, a bullish reversal signal. The Stochastic RSI indicates oversold conditions near 9.89, suggesting a potential upward bounce. The RSI Divergence Indicator is recovering from bearish momentum. Breakout confirmation above $223.58 aligns with volume profile support, targeting $244. Upward momentum strengthens as indicators suggest a bullish breakout.
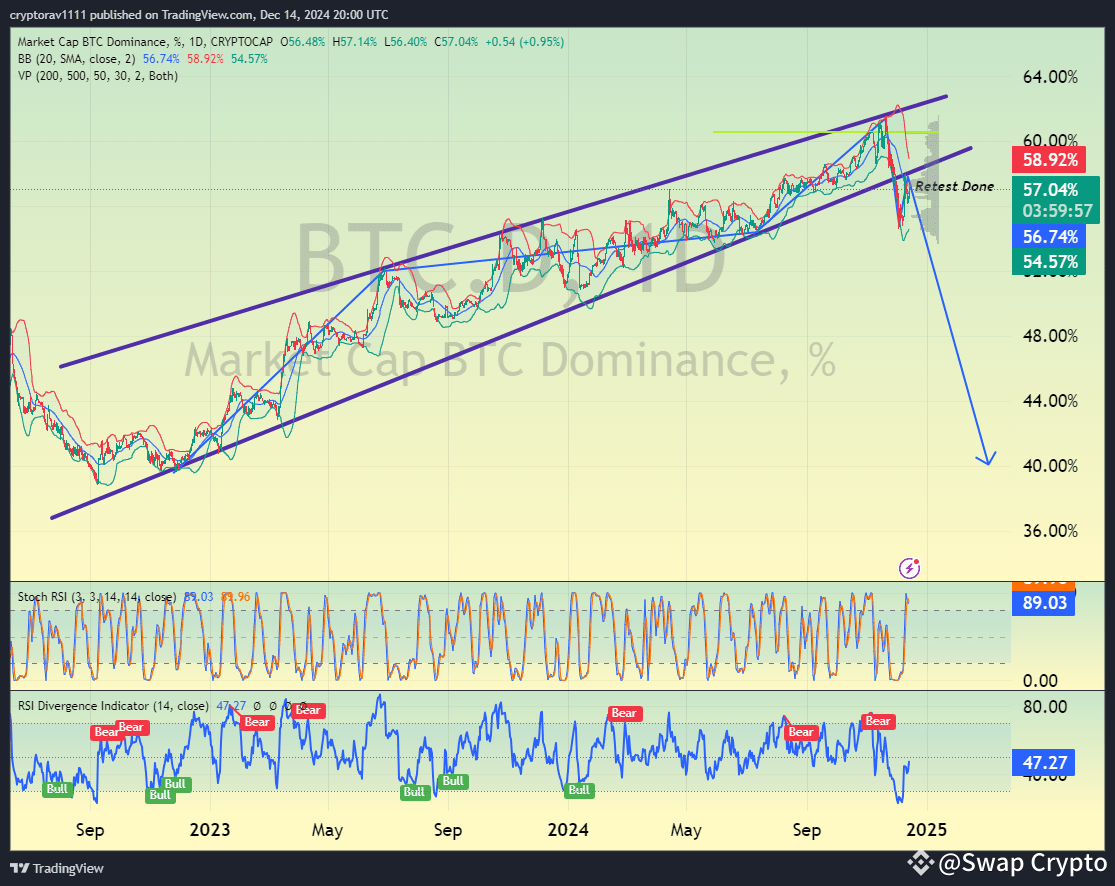
The BTC Dominance (BTC.D) chart reveals a breakdown below the rising channel, confirmed by a retest at 57%. Stochastic RSI at 89.03 indicates overbought conditions, suggesting potential dominance weakening. RSI Divergence Indicator shows bearish pressure near 47.26. This decline in dominance hints at capital rotation into altcoins, supporting a bullish outlook for SOL and other altcoins.
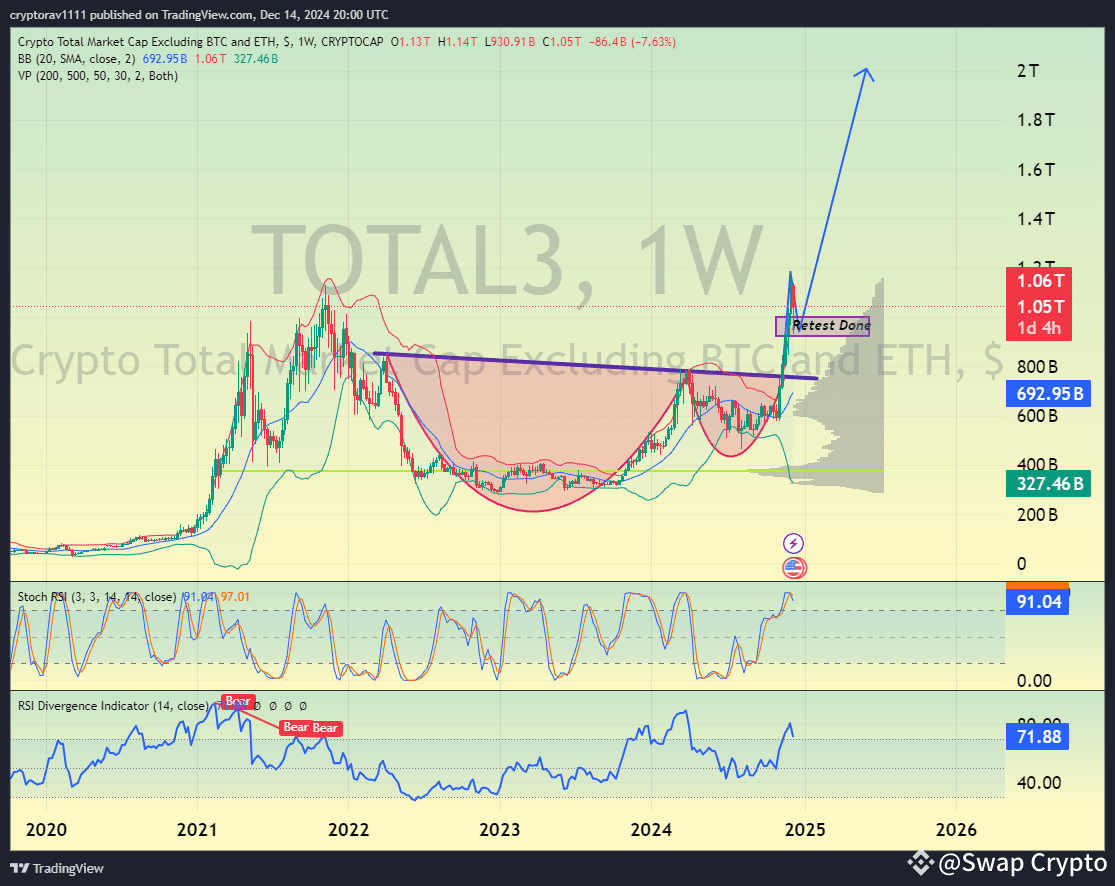
The TOTAL3 chart shows a bullish breakout after retesting prior resistance at $1.05T. The cup-and-handle pattern signals strength, supported by Bollinger Bands tightening, suggesting imminent volatility. Stochastic RSI at 91.04 indicates overbought momentum, while the RSI Divergence Indicator at 71.88 confirms bullish sentiment. These indicators reinforce the potential for a capital influx into altcoins, favoring SOL's bullish trend.
The SOL/USDT liquidation heatmap shows high liquidation clusters near $230, indicating potential resistance. Reduced liquidations below $220 suggest accumulation, supporting a bullish trend continuation.

Entry: 216.59 or Market Price
1st Tp: 226.66
2nd Tp: 234.65
3rd Tp : 244.07
This signal is only for spot if you want future signals join my binance live.
Just click on my profile to join my live.
