

Daily Market Report, 10 April
The crypto market has slid downwards by another 3% over the last day, bringing the total market cap from well over $2.6 trillion to around $2.59 trillion.
The crypto market’s heatmap also indicates that the reds are spread across the entire market.

Considering how close the halving is at this point, we can say that the high volatility across the market is warranted.
In terms of liquidations, it appears that the market’s movements over the last day, have not favoured the bulls by any means.

Over the last day, leveraged traders across the market have lost around $290 million, with the bulls taking the cake at around $$237 million, and the bears coming in with the remaining $52 million.
Overall, we can say that the Bears have had the upper hand over the last 24 hours.
Where To With Bitcoin?
Bitcoin’s decline from around $72,800 became even more pronounced over the last two days, considering its current price of around $69,460 at the time of writing.

However, the silver lining in all of this is how the 25-day moving average has been able to hold the cryptocurrency up from here.
Despite the volatility, Bitcoin’s RSI shows neutrality, indicating that the bulls still have plenty of chances to turn things around.
However, investors still cannot rule out the possibility of a decline below the 25-day moving average of around $68,000.
Bitcoin must remain above this level to prevent a decline to $66,000 or even lower.
Ethereum Lost The $3,660 Support
Over the last day, Ethereum declined underneath the $3,660 support, after breaking above only a day before.
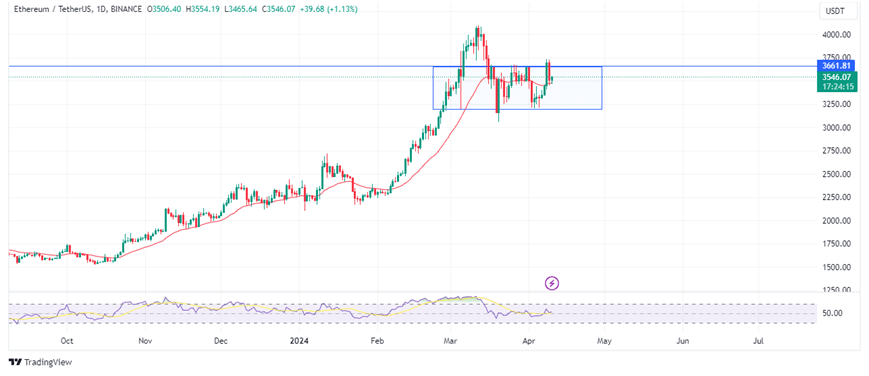
The cryptocurrency's price action is similar to that of Bitcoin, in that the 25-day moving average (around $3,478) is doing a solid job of keeping the cryptocurrency hoisted above a possible drop to $3,000.
With this in mind, this moving average must remain unbroken from here.
Can Fantom Break $1
Fantom is making a strong attempt at breaking the $1 resistance from here, after rebounding off the ascending trendline shown below:

We can expect the resulting price action to be massive on Fantom if we see a break above $1.
Beyond $1, investors can keep an eye on the local $1.22 resistance, considering how it stands as the gateway to a stronger rally to a retest of the $1.4 target.
Watch Out For Pendle
Despite the general market declines, Pendle seems to be less affected by the whole thing.
The cryptocurrency has been trending upwards for weeks now, as shown by the snapshot below.

As seen, Pendle just rebounded off the $6 level and is attempting to continue its rally further upwards from here.
According to indications from the Fibonacci retracement tool, the next target for Pendle might sit at around $8.3 from its current price.
Tron Is About To Rebound
According to the charts, Tron has been on a bullish roll for a long time and doesn't seem to be much affected by the general market volatility.
We can verify this from this ridiculously long bullish trend that has been valid since November 2022.

Tron attempted to break the $0.15 resistance in February 2023. However, after a rejection, the cryptocurrency was forced to retest the trendline and break below its 25-day moving average once again.
As we can see from the above, Tron is attempting to break above this moving average once again and should be ready to make another kick at $0.15 pretty soon.