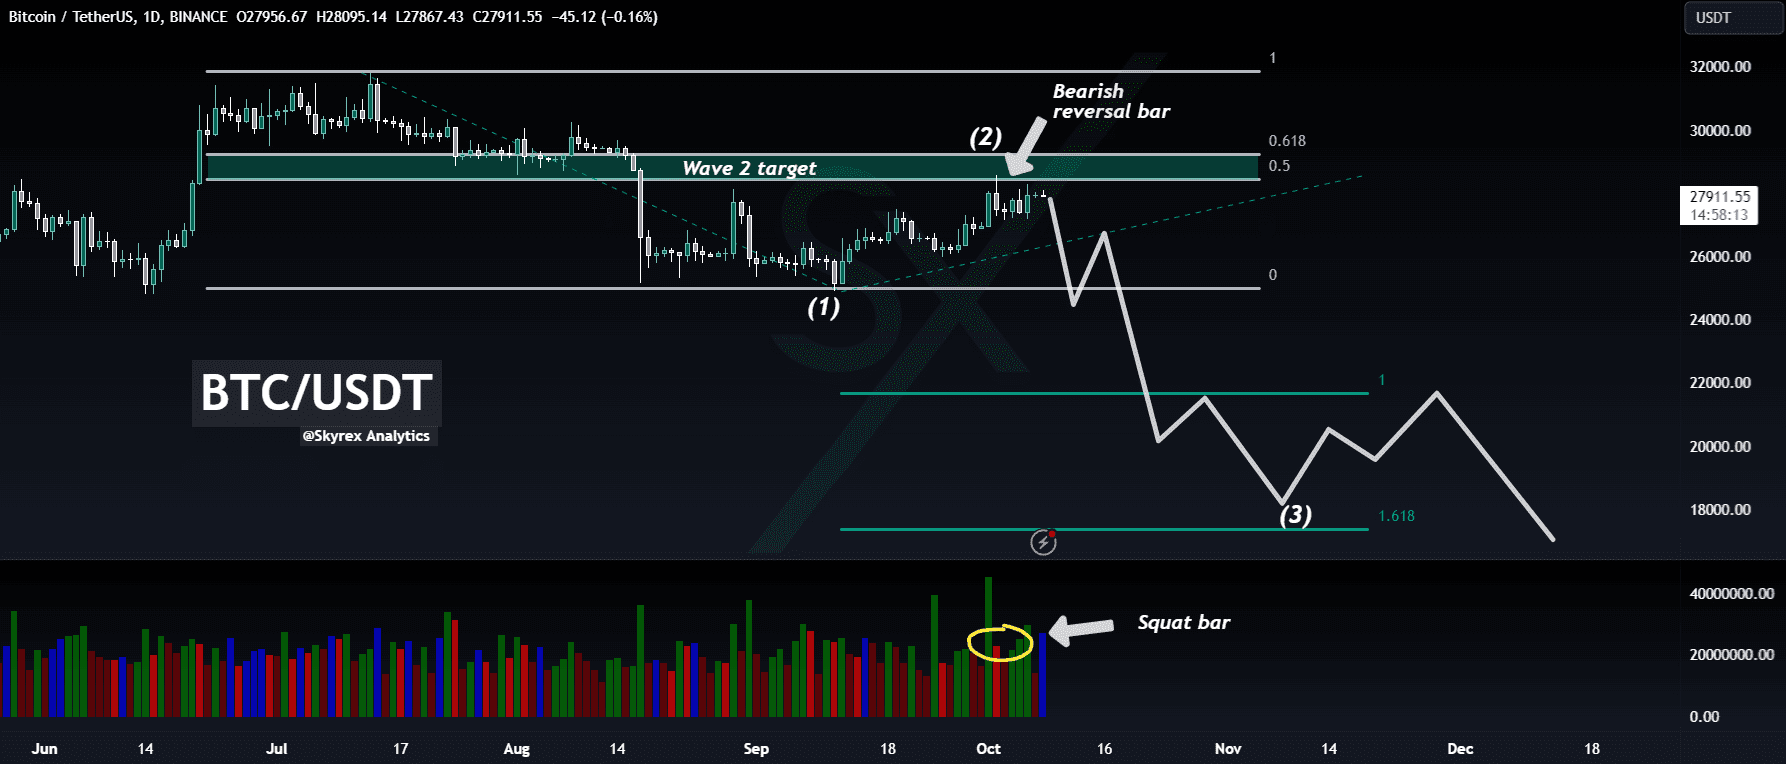
ABC Correction Post Impulsive Wave 1:
The 1D time frame BTC/USDT chart reveals an intriguing pattern. After a notable impulsive wave 1, Bitcoin underwent an ABC correction, retracing to the 0.5-0.61 Fibonacci levels. This correction, identified as wave 2, appears to have concluded.
2. Bearish Reversal Bar and MFI State:
One of the compelling signals pointing towards a potential downturn is the presence of a bearish reversal bar on the chart. This bar, combined with the Money Flow Index (MFI) indicating a squat state, forms a substantial reversal signal. The MFI squat can be interpreted as a period of indecision, where neither bulls nor bears have clear control.
Elliott Waves and Downside Targets 📊
1. ABC Correction or 5 Elliott Waves Cycle:
The analysis contemplates two potential scenarios: whether Bitcoin is undergoing an ABC correction or if it's part of a 5 Elliott waves cycle to the downside. The ambiguity in this distinction adds an element of uncertainty to the market outlook.
2. Target 1 Fibonacci Extension: $21,500
Regardless of the corrective pattern, the analysis points towards a shared target: the 1 Fibonacci extension, pegged at $21,500. This figure stands as the first target in the potential downward trajectory.