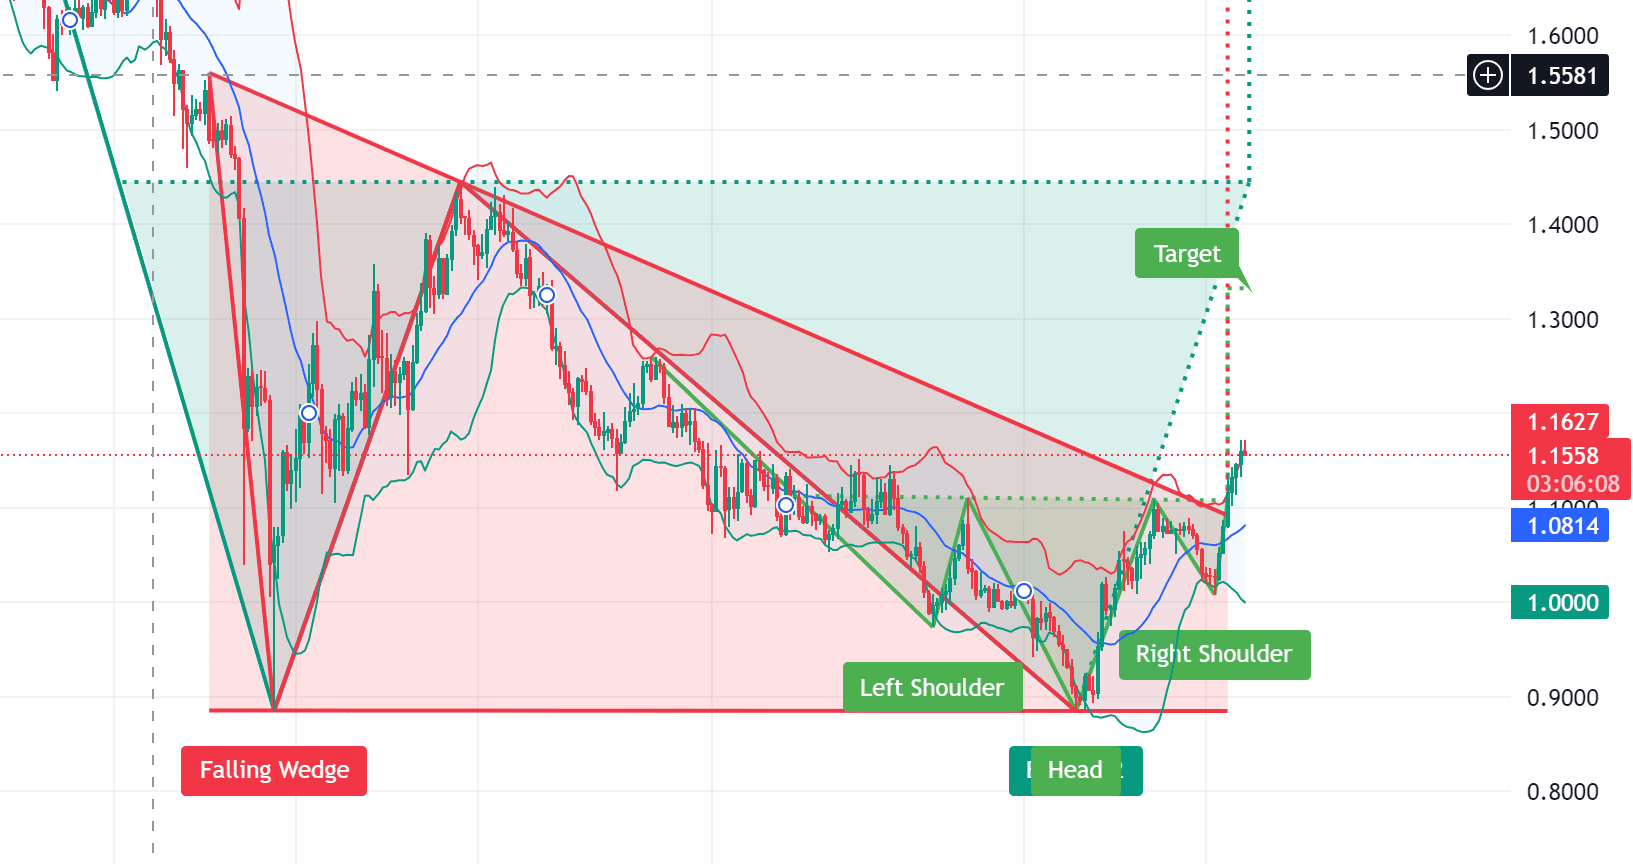
SUI, I can see a SUI 7
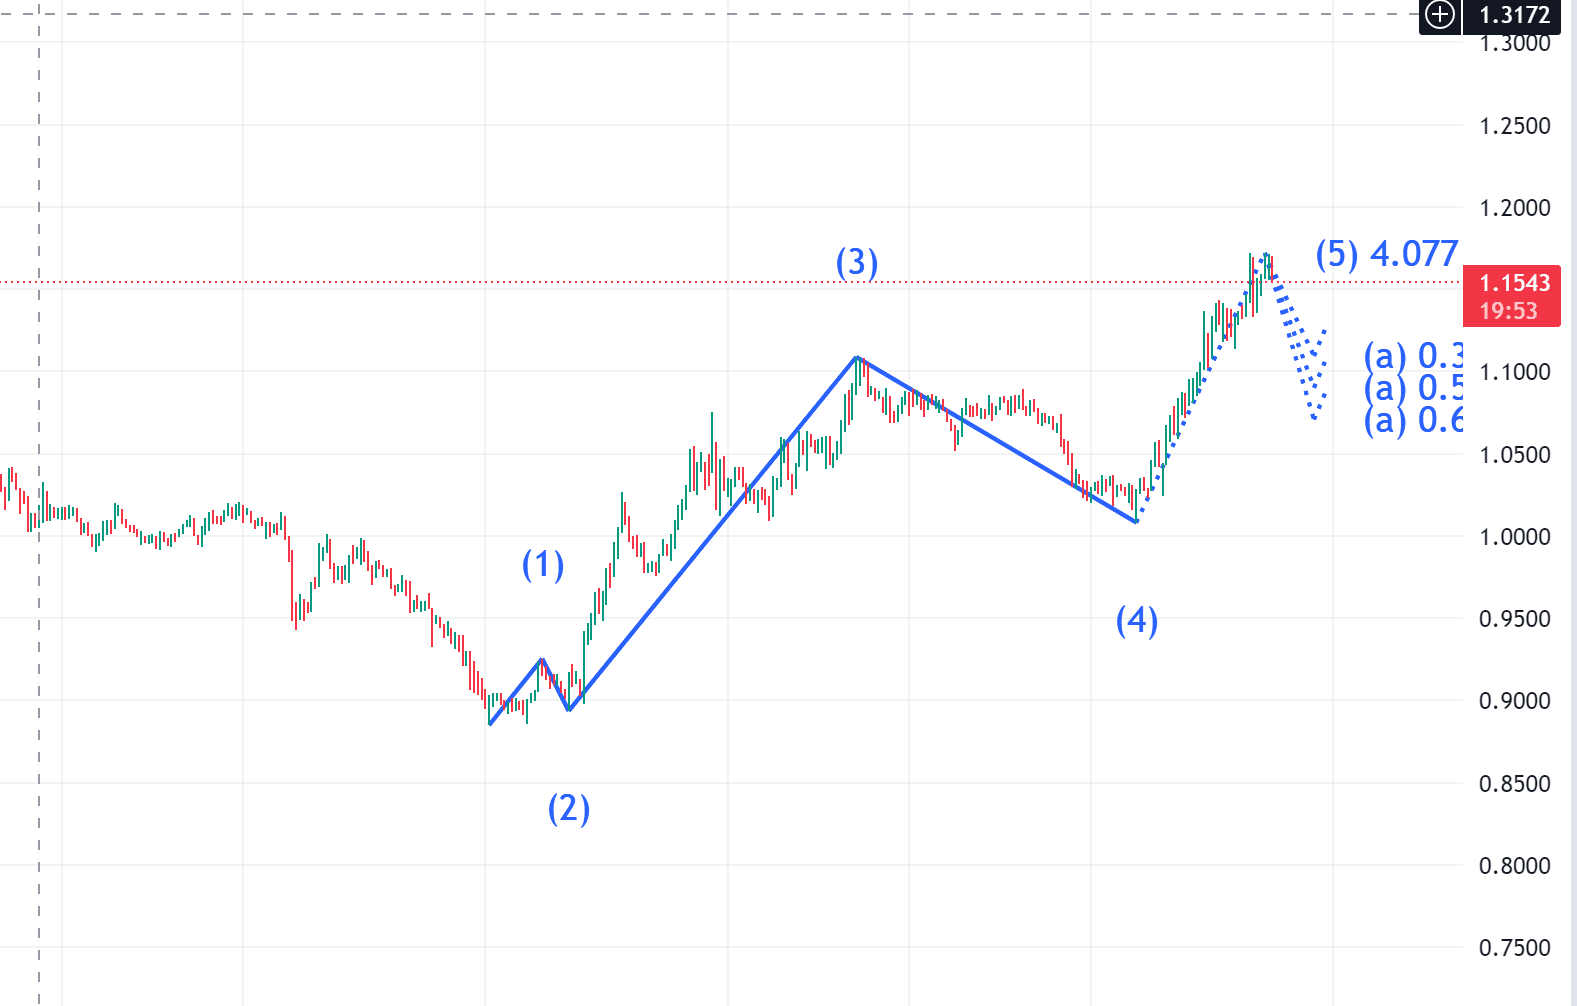
The whole shape of SUI began to form a descending wedge and formed a double shoulder top. The price was at the upper boundary of the descending wedge and the neckline of the double shoulder top. The subsequent trend broke through the upper boundary of the descending wedge and the neckline of the double shoulder top and continued to rise. According to the graphic shape, it did not get effective value. The middle track of its Bollinger band is below the K line and keeps approaching, indicating that the buyer's momentum is constantly weakening. According to the Elliot wave theory, it is currently in the 5th wave of the rising wave and has a trend of turning to the falling wave a.
Note: The analysis should be requested by the commenting friends.
#SUI.24小时交易策略 #SUI.智能策略库🥇🥇 #SUI.每日智能策略 #suis
If you need professional and effective analysis, please leave a message and follow.