
RSI indicator one of the easiest and most essential in Trading.
What is it?
RSI (Relative Strength Index) or Relative Strength Index is basically an indicator that, through a formula, does not indicate whether or not the asset is overbought or oversold.
It calculates it using the following mathematical formula: RSI = 100 – 100/(1+(average of bullish closes/average of bearish closes))
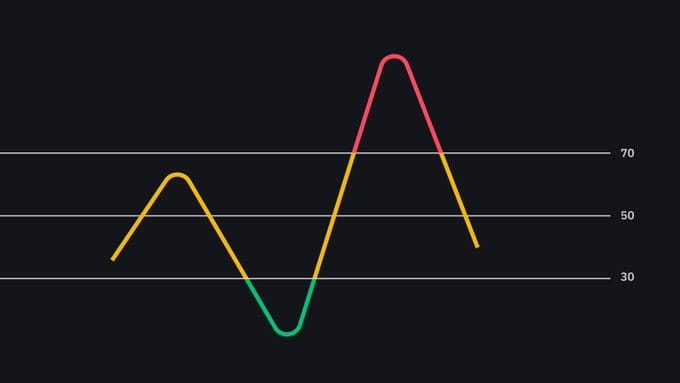
Graphic representation:
The RSI represents this formula, with a line that will move through a numerical range, where 100 will be the maximum overbought and 0 the maximum oversold.

When is it considered overbought or oversold?
The standard system indicates that above 70 would be seriously overbought and below 30 would be seriously oversold. Personally, I am more comfortable using a range of 80 - 20 where we filter out many false signals from the indicator.
We can set this configuration in 2 ways
Option 1: We place 2 lines on the indicator at 80 - 20 and keep the standard 70 - 30

Option 2:
We modify the Upper Band and Lower Band parameters from the configuration to 80 - 20, leaving only the latter.

Other interesting aspects to have configured:
The length of the RSI: At 14, which is the standard, is where I have seen it work best, but you can experiment.

Have RSI-Based MA active:
It will indicate an average to give us an idea with less volatility of where we are, it will also give us buy and sell signals when the RSI crosses the average, or when the average crosses the balance point of 50. Working the same as a normal MA.
An example of a Short and Long operation using Over-Buying and Over-Selling 👇

Divergences:
The real potential of the RSI and many other indicators is not in the above, which is obviously very useful, but in the divergences.
We will see the divergences in the second part of this article on the RSI (Part 2)
Because there are many divergences, although the general public only knows one, the most typical.
But I want to show them all, it is essential.
Thanks for reading, will continue soon. Arnau4bet

