Introduction
Traders can use a variety of technical analysis (TA) tools and indicators to try and predict future price movements. This can include full market analysis frameworks such as the Wyckoff Method, Elliott Wave Theory or Dow Theory, as well as TA indicators such as moving averages, RSI, Stochastic RSI, Bollinger Bands, Ichimoku Kinko Hyo, Parabolic SAR and MACD.
The Fibonacci Retracement tool is a commonly used indicator by thousands of traders in the stock, forex, and cryptocurrency markets. Interestingly, it is based on the Fibonacci sequence, which was discovered over 700 years ago.
This article will explain what the Fibonacci retracement tool is and how to use it to find important levels on your chart.
What is a Fibonacci Retracement?
Fibonacci retracements are a tool used by technical analysts and traders to predict areas of interest on a chart. They do this by using Fibonacci ratios as percentages. The Fibonacci retracement tool is derived from a sequence of numbers discovered by 13th century mathematician Leonardo Fibonacci. This sequence of numbers is called the Fibonacci sequence. The specific mathematical relationships between the numbers in this sequence create ratios that are then plotted on a chart. These ratios are:
0%
23.6%
38.2%
61.8%
78.6%
100%
Although 50% is not technically a Fibonacci ratio, some traders still consider this level to be of some significance because it represents the midpoint of the price range. Fibonacci ratios outside the 0-100% range can also be used, such as 161.8%, 261.8%, or 423.6%.
We will discuss how traders can use these percentages, but the main point is that the levels they outline can correlate to important levels in the market. When plotted onto a price chart, Fibonacci levels can be used to identify areas of interest such as support, resistance, retracement zones, entry points, exit points, and stop loss levels.
How to Calculate Fibonacci Retracements
Since these percentages are the same in every Fibonacci retracement tool, you don’t have to calculate anything manually. However, the way to get them is to start with the Fibonacci sequence.
Let's create a sequence of numbers starting from 0 and 1, and keep adding the sum of the previous two numbers to the current number. If we add it infinitely, we will get a series of numbers called the "Fibonacci sequence".
0, 1, 1, 2, 3, 5, 8, 13, 21, 34, 55, 89, 144, 233, 377, 610, 987… and so on.Of course, these numbers are not directly plotted on the price chart. However, the levels used in the Fibonacci retracement tool are all derived from these numbers to some extent.
If you divide a number by the number after it, minus the first few numbers, you get a ratio close to 0.618. For example, 21 divided by 34 gives 0.6176. If you divide a number by the second number to the right, you get a ratio close to 0.382. For example, 21 divided by 55 gives 0.3818. All the ratios in the Fibonacci retracement tool (except 50%) are based on some calculations of this method.
Fibonacci numbers and the golden ratio
As mentioned above, the Fibonacci numbers were proposed by mathematician Leonardo Fibonacci in the 13th century. The Golden Ratio (0.618% or 1.618%) is a mathematical ratio derived from these numbers. Why is it such an important number?
The Golden Ratio describes the proportions of some amazing phenomena in the universe, and these phenomena can be seen all over nature. Think atoms, stars, galaxy formation, seashells, even bees – objects from the smallest to the largest may all follow this ratio.
What’s more, it’s been used by artists, engineers, and designers for centuries to create aesthetically pleasing works. From the pyramids to the Mona Lisa to the Twitter logo, many famous works of art and design use the golden ratio in some way. And it turns out that this ratio may also have important implications in the financial markets.
How to Use Fibonacci Retracements
Now that we understand what the Fibonacci retracement tool is and how it works, let’s consider its uses in the financial markets.
Typically, the tool is drawn between two significant price points, such as a high and a low. This range is then used as a basis for further analysis. Typically, the tool is used to draw levels within a range, but it can also provide insight into significant price levels outside of a range.
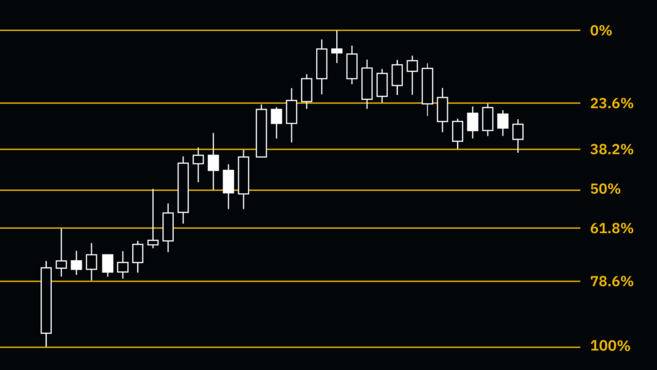
This range is usually drawn based on the underlying trend. So, in an uptrend, the low is 1 (or 100%) and the high is 0 (0%). By drawing Fibonacci retracements on an uptrend, traders can get an idea of potential support levels that might be tested in the event that the market begins to pull back — hence the term retracement.
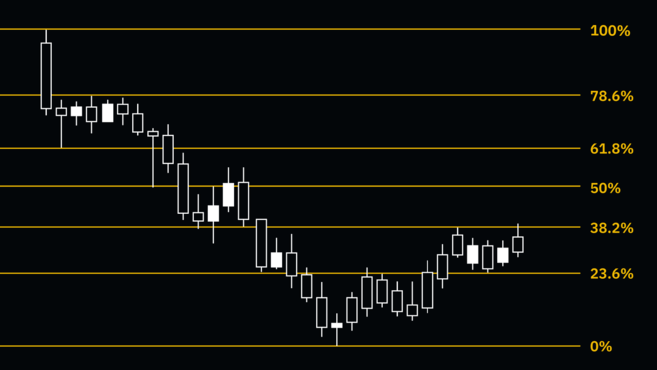
Conversely, in a downtrend, the low is 0 (0%) and the high is 1 (100%). Note that the price is in a downtrend. Therefore, a retracement in this case refers to a movement (bounce) from the bottom. In this context, if the market begins to rise, the Fibonacci retracement tool may provide insight into potential resistance levels.
Want to start your cryptocurrency journey? Buy Bitcoin on Binance now!
What Can Fibonacci Levels Tell Traders?
Traders can use Fibonacci levels to identify potential entry areas, price targets, or stop-loss points. This can vary significantly depending on personal setup, strategy and trading style.
Some strategies involve taking profits within the range between two specific Fibonacci levels. For example, consider a pullback after an uptrend. Buying at the 38.2% retracement level and then selling at the 23.6% level could be an interesting strategy. Of course, this is highly dependent on the individual strategy and many other technical factors.
Fibonacci levels are also often used in conjunction with Elliott Wave Theory to find correlations between wave structures and potential areas of interest. This can be a powerful strategy for predicting the extent of pullbacks within different waves of a particular market structure.
Like other methods, the Fibonacci Retracement tool works best when used in conjunction with other technical analysis indicators. A signal that was not originally a buy or sell signal may become one if confirmed by other indicators. Therefore, when the price reaches a specific Fibonacci level, it may or may not reverse. Therefore, it is crucial to manage risk, as well as consider the market environment and other factors.
Fibonacci Expansion
As mentioned above, Fibonacci levels can be used to assess pullback or rebound areas (number 1 in the animation below). But in addition, Fibonacci numbers can also be used as a way to measure potential important levels outside of the current range. These are called extension levels (see number 2).
Fibonacci Extension levels may be considered as potential trading targets. Each trader may choose a different extension level as a target (or multiple targets). The first few extension levels were 138.6%, 150%, and 161.8% — followed by 261.8% and 423.6%. Therefore, Fibonacci Extension levels may indicate the next end point of a price movement.
Summarize
Fibonacci numbers are found throughout nature, and many traders consider them to be relevant when charting financial markets.
However, as with all technical indicators, the relationship between price action, chart patterns, and indicators is not based on any scientific principles or laws of physics. Therefore, the usefulness of the Fibonacci retracement tool may be related to the number of market participants paying attention to it. Therefore, even though Fibonacci retracement levels are not necessarily related to anything tangible, they can be used as a tool to try and predict areas of interest.


