The Dow Theory, which has a very long history in technical analysis, is the first theory to explain that the market will fluctuate according to trends. It is also the theoretical basis of technical analysis. Because it is the earliest technical analysis theory, it will be mentioned in many similar analyses later.
This article focuses on introducing traders to the basic concepts, usage methods and trading strategies of using Dow Theory in combination with boxes, wedges and ascending triangles.
1. Use the box-shaped trend-following trading strategy
The box, also known as the rectangular pattern, is a chart pattern that often appears during trend consolidation. It will cause buying and selling to wrestle with each other. Neither the high nor the low point will change, and it will oscillate back and forth within a certain price range, thus forming a box market.
In such a case, it will connect the high price and the resistance line connected to it, or the low point and the support line connected to it in an almost parallel manner, thus forming a rectangular shape, and thus getting the name of a box or rectangle.
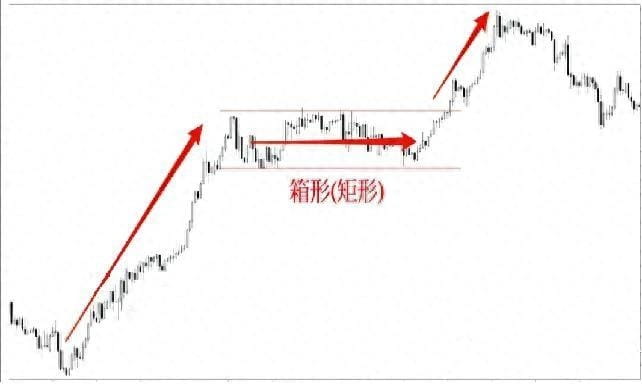
Basically, the possibility of a box-shaped breakout trend is extremely high; once it appears in an upward trend, people can expect a subsequent upward breakthrough.
Specifically, you can enter the market when the price breaks through the resistance line of the box. In addition, in order to avoid false breakthroughs, you should first confirm the trend of regression (the trend until it returns to the resistance line) and then buy on dips, rather than entering the market directly after the breakthrough; this way, you can avoid reversals after the breakthrough and reduce the probability of false breakthroughs.
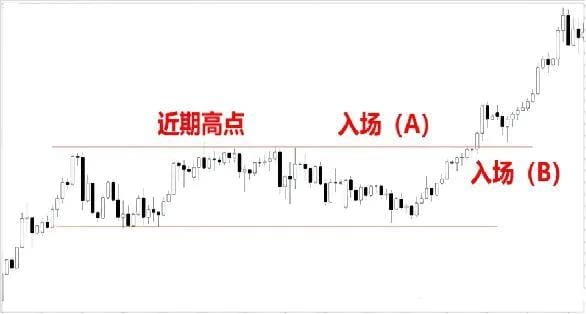
Entry Operation
(A) Based on the premise of meeting the rising trend conditions of Dow Theory, when the box is formed, enter the market when the box breaks through the resistance line.
(B) Based on the premise of meeting the rising trend conditions of Dow Theory, when the box is formed, enter the market when the box breaks through the resistance line and shows a regression trend.
2. Trend-following trading strategy using wedges
The wedge is a common chart pattern in trend adjustment situations. A wedge that appears in an upward trend is characterized by causing both high and low prices to move downward at the same time, with a small downward oscillation adjustment.
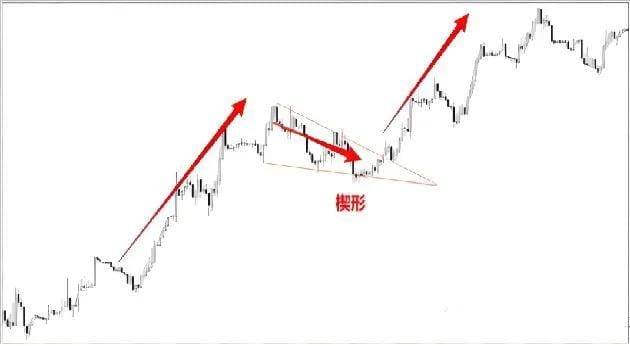
After the wedge ends, it is possible to break through the resistance line and resume the uptrend, so if a wedge is confirmed on the chart, you can use this fluctuation to buy on dips, such as the time when the price breaks through the resistance line.
In addition, as with the flag and pennant patterns, you can also enter the market at the latest high point before the wedge is formed. According to the idea of Dow Theory, if the upward trend continues after a new high point, a higher wave of gains can be expected.
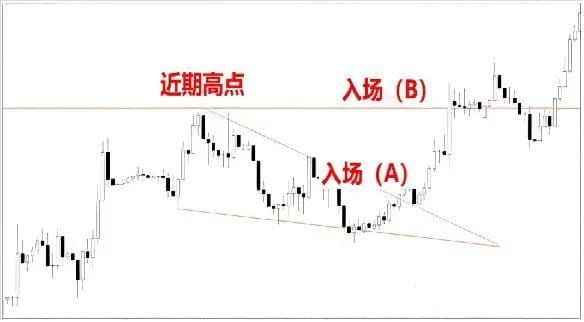
Entry Operation
(A) Based on the premise of meeting the rising trend conditions of Dow Theory, when the wedge is formed, enter the market when the wedge breaks through the resistance line.
(B) Based on the rising trend conditions that meet the Dow Theory, after the wedge is formed, enter the market when the wedge breaks through the resistance line or at the highest point before the wedge is formed.
3. Using the ascending triangle trend trading strategy
In the chart pattern of the ascending triangle, the resistance line will be horizontal and the support line will gradually rise. It is another derivative triangle of the pennant type mentioned in the previous article (Dow Theory combined with the trend trading strategy of the flag or pennant), and is also common in the adjustment situation of the upward trend. In the offensive and defensive battle between buying and selling, it will appear when the buying trend becomes stronger, that is, the high point will maintain the original shape, and the low point will slowly move up, thus forming a triangle.

When an ascending triangle is formed, the final price may break through the upper or lower line. If it breaks through the resistance line, it may strengthen the upward momentum. Therefore, if you want to use the ascending triangle for trading, you should enter the market at the time of breaking through the resistance line.
Entry Operation

Based on the rising trend conditions that meet the Dow Theory, when the ascending triangle is formed, enter the market when the resistance line is broken.


