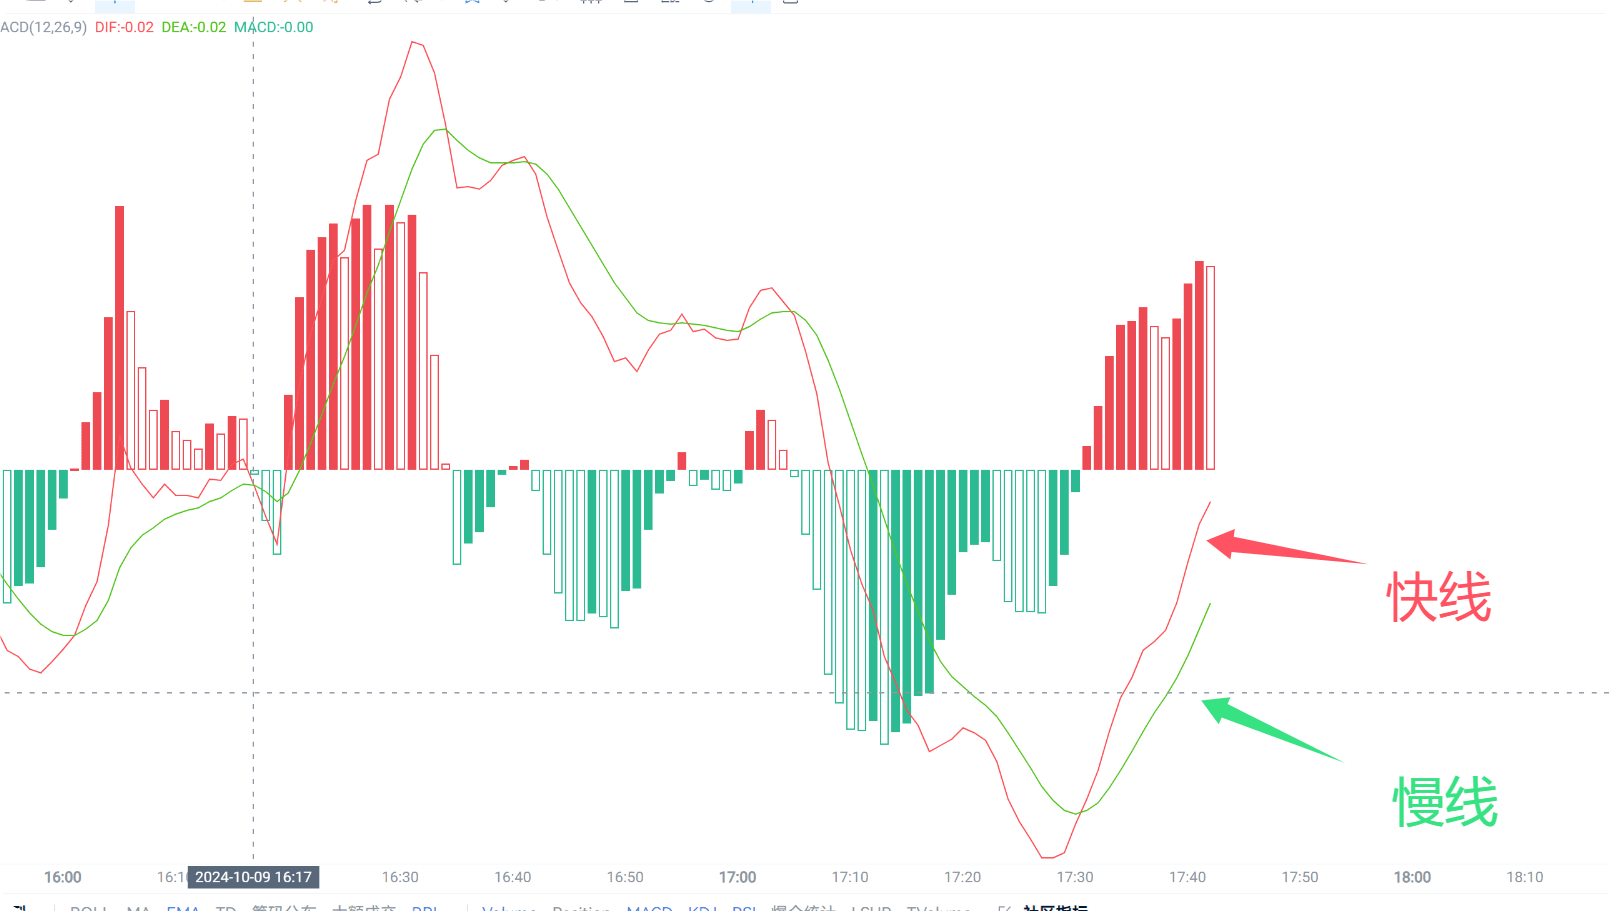
MACD refers to the smoothed moving average, which is a trend-based trading type with the nature of right-side trading. In ordinary market trading software, this indicator is composed of yellow and white lines, red energy columns and 0 axis. The white line representing DIF is the short-term fast line; the yellow line is DEA, which is the average level of DIF in a certain period of time; the red energy column is long; the green energy column is short; and the 0 axis is the long-short boundary.
MACD is a product of the dispersion, aggregation and area size of the fast and slow moving averages, red and green columns, which show the current long and short situation, the trend momentum and possible evolution pattern of stock prices, and the time to judge buying and selling. MACD is more convenient and intuitive to read. Usually, when the MACD indicator changes from negative to positive, that is, the energy column changes from green to red, it is a bullish signal, that is, a turning point. When the MACD indicator changes from positive to negative, that is, the energy column changes from red to green, it is a signal of decline or conversion. With the rapid change of MACD, the difference between the fast moving average and the slow moving average will expand rapidly, which is a large market trend conversion. In practice, the MACD indicator has multiple rules, which are far from as simple as mentioned above. There are many false lines in the MACD indicator, so determining the final long and short conversion becomes a key point for investment profit. This also reflects the complexity, variability and difficulty of prediction of stock investment. Therefore, investors should look at the trend of the stock market with a respectful attitude, invest prudently, and do a good job of risk prevention and control.


