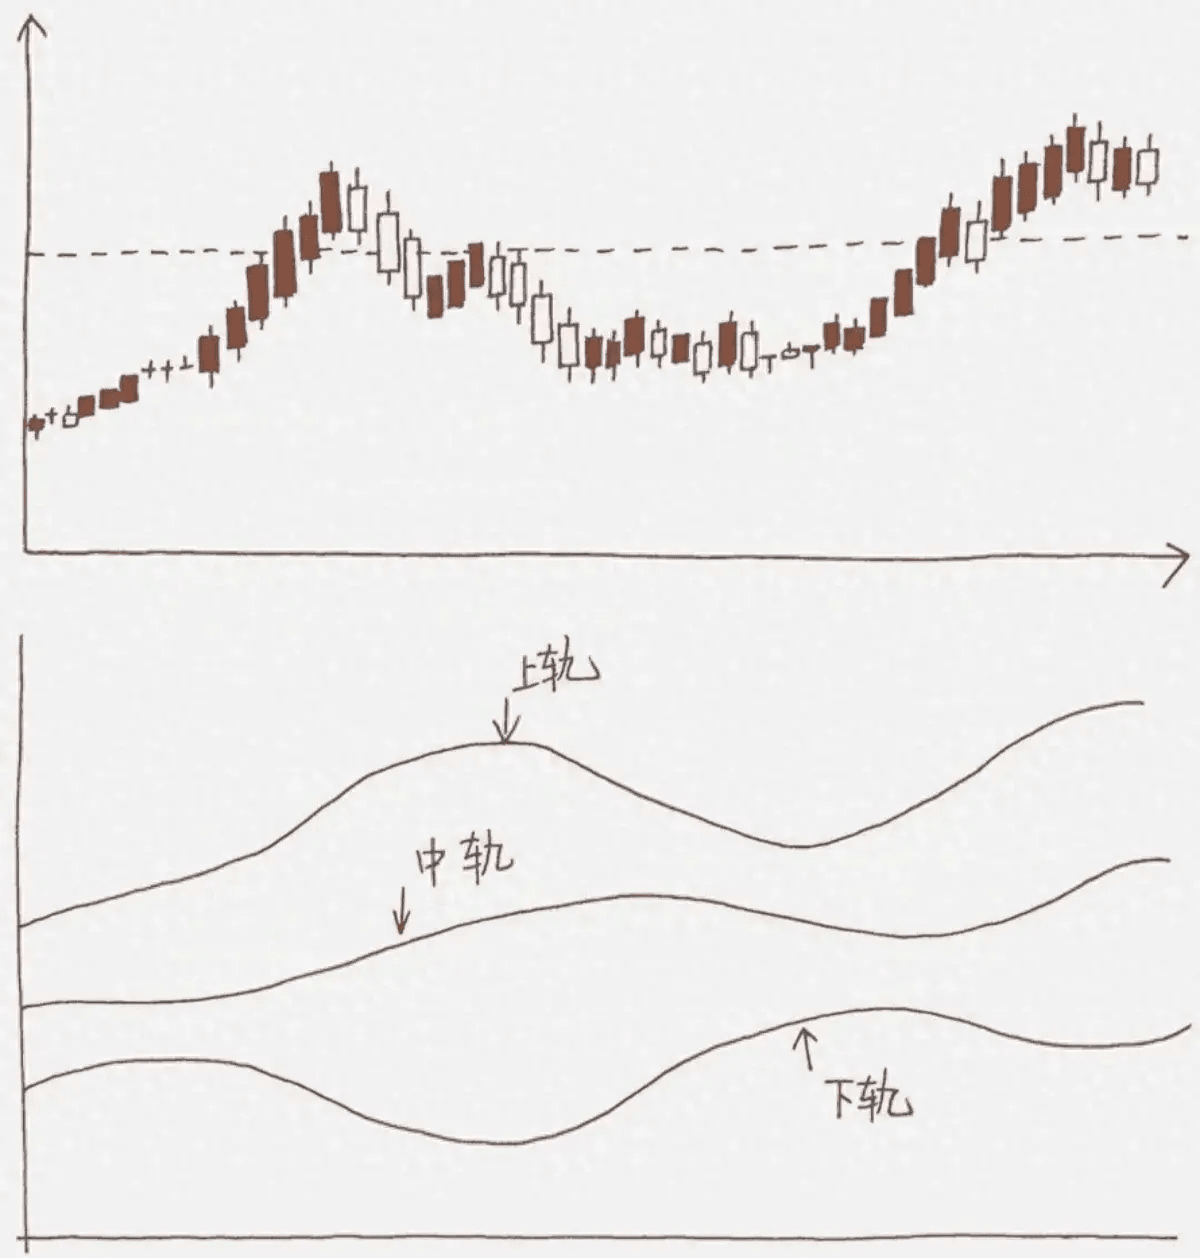
Bollinger Bands, also known as Bollinger Channels, are a technical indicator used to indicate the trajectory of price movement. BOLL is composed of three curves: the upper track, the middle track, and the lower track. Here, the middle track is the moving average of the price (usually the 20-day moving average), while the upper and lower tracks are the middle track value plus and minus a specific number (usually 2 standard deviations).
The band between the upper and lower tracks is called the "Bollinger Band". Generally speaking, when the price rebounds from the support of the lower BOLL track, it is a bullish buy signal.
When the price encounters resistance and pulls back at the upper track of BOLL, it is a bearish sell signal. When the price falls below the lower track of BOLL, leaves the track of BOLL, and re-enters the track of BOLL, it is generally a bullish buy signal.
When the price crosses the upper track of BOLL, leaves the track of BOLL, and returns to the track of BOLL, it is usually a short selling signal.
The BOLL channel is based on the principle of probability statistics. In actual operation, it should be combined with other factors such as stock prices for comprehensive analysis. When using the BOLL index, investors should pay attention to the following matters:
(1) BOLL uses "price channels" to indicate different price levels. When the price fluctuates slightly and is consolidating, the price channel becomes narrow, indicating that the price fluctuation has temporarily eased; when the price moves on the upper or lower track of a narrow price channel, it indicates that the price will begin to rise and fall sharply. When the channel expands, it forms a "trumpet". When the BOLL horn opens and the middle track rises, it is a buy signal for bulls. When the BOLL horn opens, if the middle track falls, it is a sell signal for bears.
(2) When the price of the BOLL index changes, its three curves will also change accordingly. The three curves can also rise or fall rapidly when the price fluctuates greatly. Therefore, when the price is supported at the lower track of the BOLL, it may fall further in the future as the lower track falls; sometimes, when the price breaks through the resistance line of the upper track of the BOLL, as the upper track rises, the stock still has a lot of room for growth in the future.
(3) In actual operation, BOLL, MACD, KDJ and other indicators can be used in combination for short-term use. This article mainly introduces some indicators and methods of process analysis. When there is a clear trend in the market, it is most effective to use trend indexes (such as moving average, MACD) because they can always follow the trend; when the market is in a consolidation stage and extremely high or low, reversal indicators such as KDJ can usually indicate the turning point of the market. Both can be combined with pressure support indexes such as BOLL to guide investment transactions with technical analysis.


