First of all, from the perspective of K-line pattern,$PEPE The price of BTC/USD has been in a box-shaped consolidation trend in recent trading. Specifically, the price fluctuates between 0.00001100 and 0.00001150. This stable fluctuation pattern reflects the relative balance and stability of the market.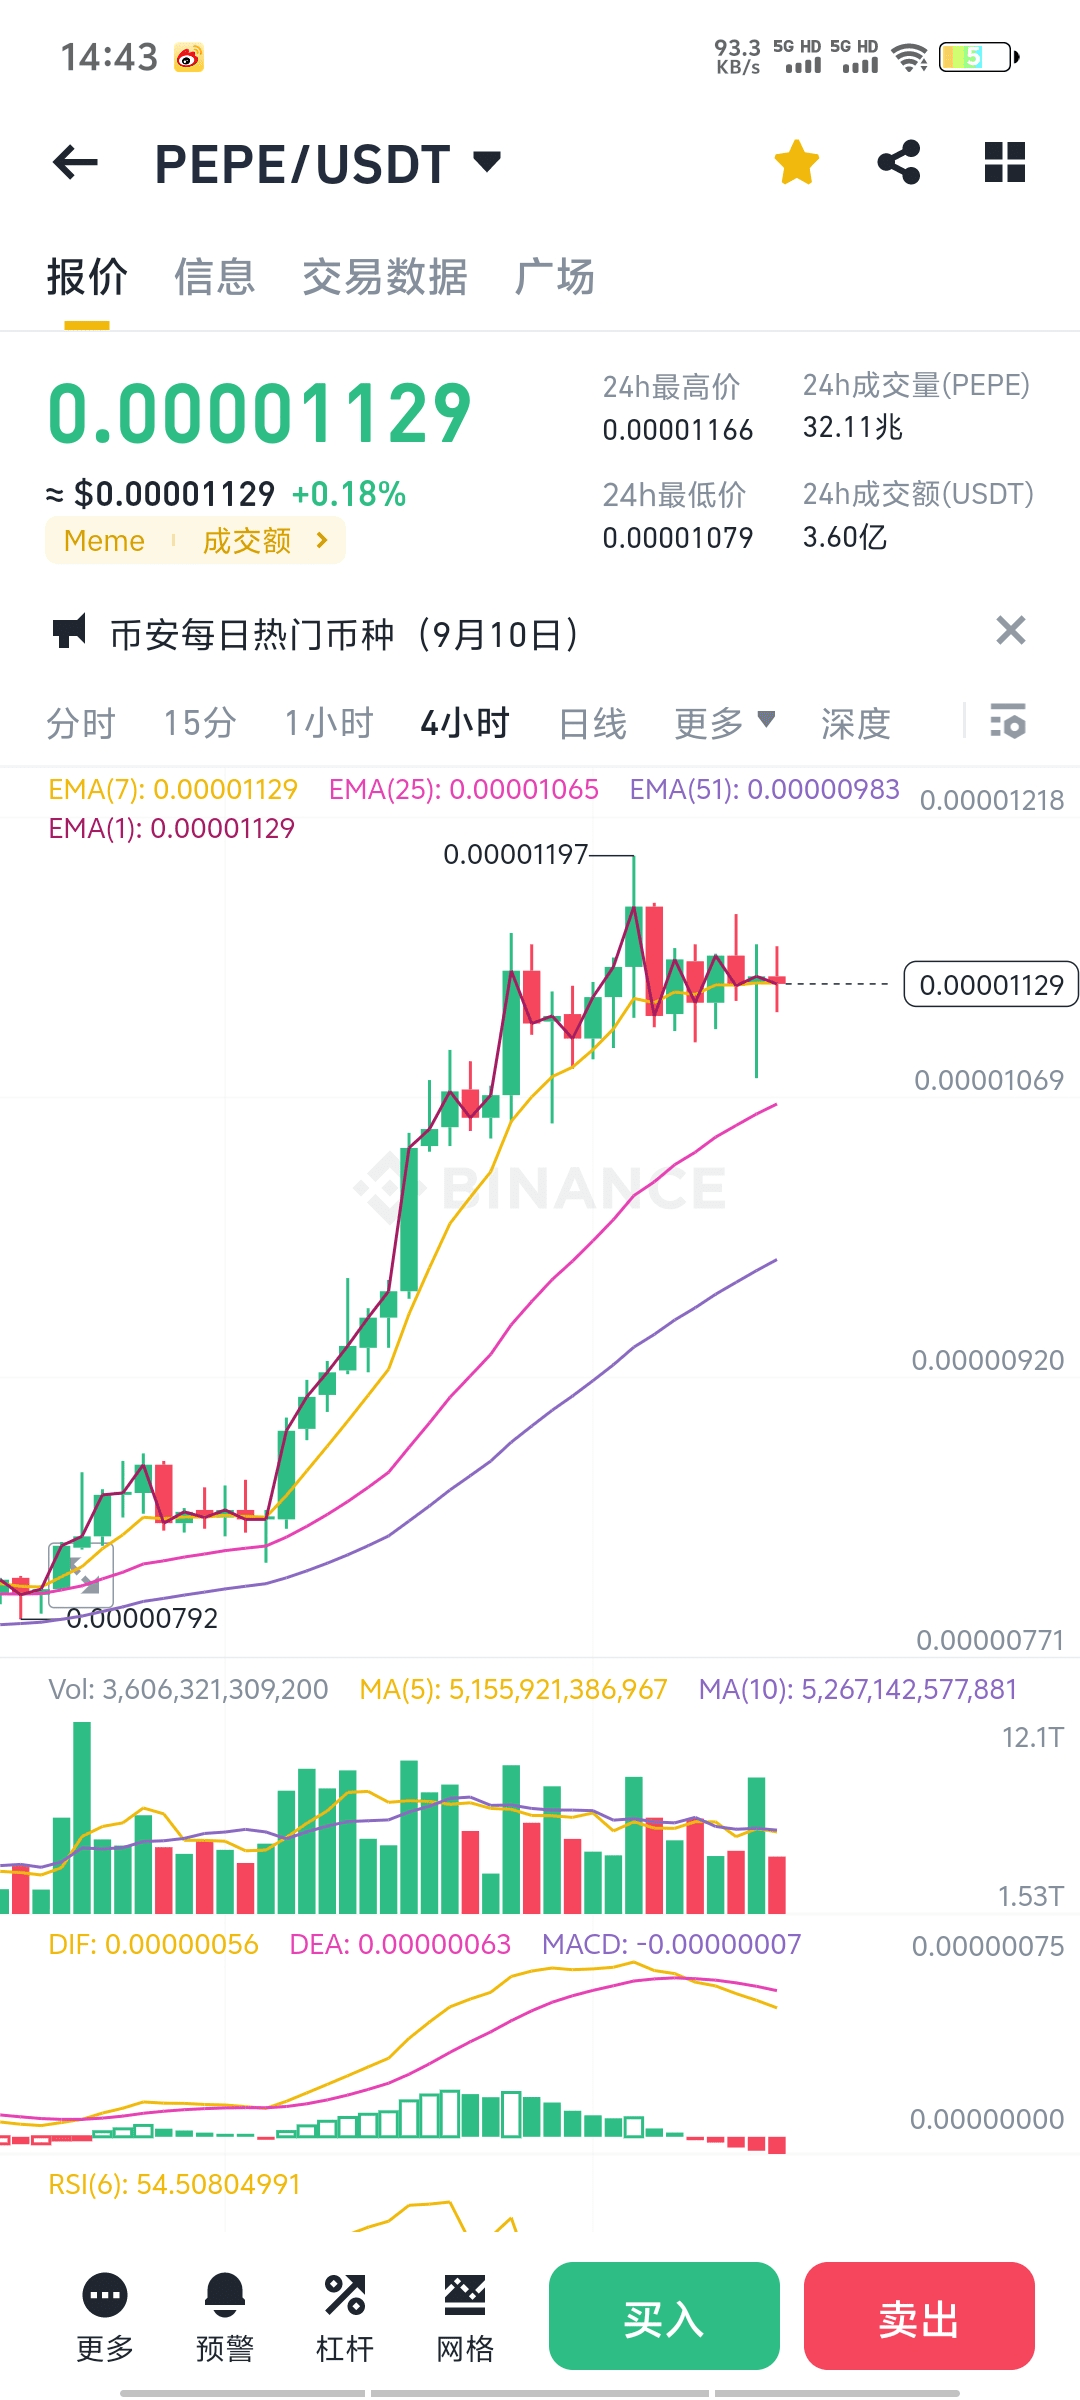
Prior to this, PEPE had experienced a clear upward trend. Starting from the low of 0.00000952 on September 27, the price quickly climbed to the high of 0.00001197 on September 29, and then began to pull back to the current level. This wave of rise and subsequent adjustment highlights the volatility and opportunities in the market.
In terms of technical indicators, Lao A analyzed several important indicators in detail. The MACD indicator shows that its fast and slow lines (DIF and DEA) are currently above the zero axis, but the DIF and DEA lines are gradually approaching, which may indicate that a death cross signal is about to appear, which means that the market may face certain adjustment pressure in the short term.
The RSI indicator reading is currently around 63, which is in the neutral to strong area. Although the market has entered the overbought zone (RSI value above 70) many times, it has not been able to maintain it continuously, which shows that there is a certain selling pressure in the market and we need to be vigilant about the possible reversal of the market.
The analysis of EMA (Exponential Moving Average) is also very interesting. EMA7, EMA30 and EMA120 are in a bullish arrangement, and the price is basically above EMA7, which shows that the overall trend is still positive. However, it should be noted that if the price falls below EMA7, it may test the EMA30 support level below.
In terms of trading volume, Lao A has observed that the volume in recent trading cycles has increased, especially between September 28 and September 29, which indicates that the market is more active. However, the current trading volume has decreased compared with the previous few days, which may mean that market sentiment is becoming more cautious and some coin friends are waiting for new direction guidance.
Regarding the 4-hour price trend of PEPE, Lao A pointed out that the current market is in a sideways state. In this market environment, the choice of buying and selling points becomes particularly important.
As for the buying point, Lao A recommends that the first point to consider is 0.00001100 USDT, because this position is close to the previous low point and is also an integer support level, which is relatively safe. The second buying point can be set at 0.00001080 USDT, where the price will further drop to a stronger support area and close to the EMA30 moving average, which is a relatively low entry point.
When setting the stop loss point, Mr. A thinks that the stop loss point for long positions can be set at 0.00001070 USDT. If the price falls below this position, it may test a lower support level, so it is not advisable to continue holding.
Regarding the choice of selling point, Lao A suggested that the first selling point could be set at 0.00001150 USDT, which is close to the recent high, because there is a large selling pressure at this position. If the market situation changes or the expected selling conditions are met, coin friends can consider taking profits near this price.
In the trading market, we need to pay careful attention to subtle changes in prices. Take 0.00001170 USDT as an example. This price point contains important market dynamics. After breaking through the previous high, the price position may encounter a new resistance range, which is usually a sign of market supply and demand adjustment. In technical analysis, this is a signal that cannot be ignored.
As for the short strategy, our stop loss point is set at 0.00001180 USDT. The basis for this decision is that if the price can break through this position, it means that the upward trend of the market is still continuing. In this case, it may not be wise to continue to execute the short strategy because it may mean a shift in the market trend. Therefore, when the price approaches or breaks through this stop loss point, we need to re-evaluate the market situation and adjust our trading strategy accordingly.
Take a recent market event as an example. When the price of a certain digital asset broke through the level of 0.00001170 USDT and began to advance towards a new resistance range, many savvy coin friends realized the changes in the market. They quickly adjusted their trading strategies and set the short stop loss point at 0.00001180 USDT to avoid possible market risks. This decision helped them successfully avoid market uncertainties and obtain better trading returns.


