
Hello everyone, I am your cat. Why did I wait until now to publish it? This has a lot to do with the wave of pull-ups in the morning. I didn't sleep, and I was afraid that the short orders would be swept away and the market would fall, so I kept watching until noon. I still need to push forward some tools as soon as possible, which is indeed a bit tiring.
Today we will no longer draw trend lines, but directly use simple and crude indicators to see what is happening.
We try to figure out how the subsequent market will develop based on different forms and indicators.
Still start from $BTC
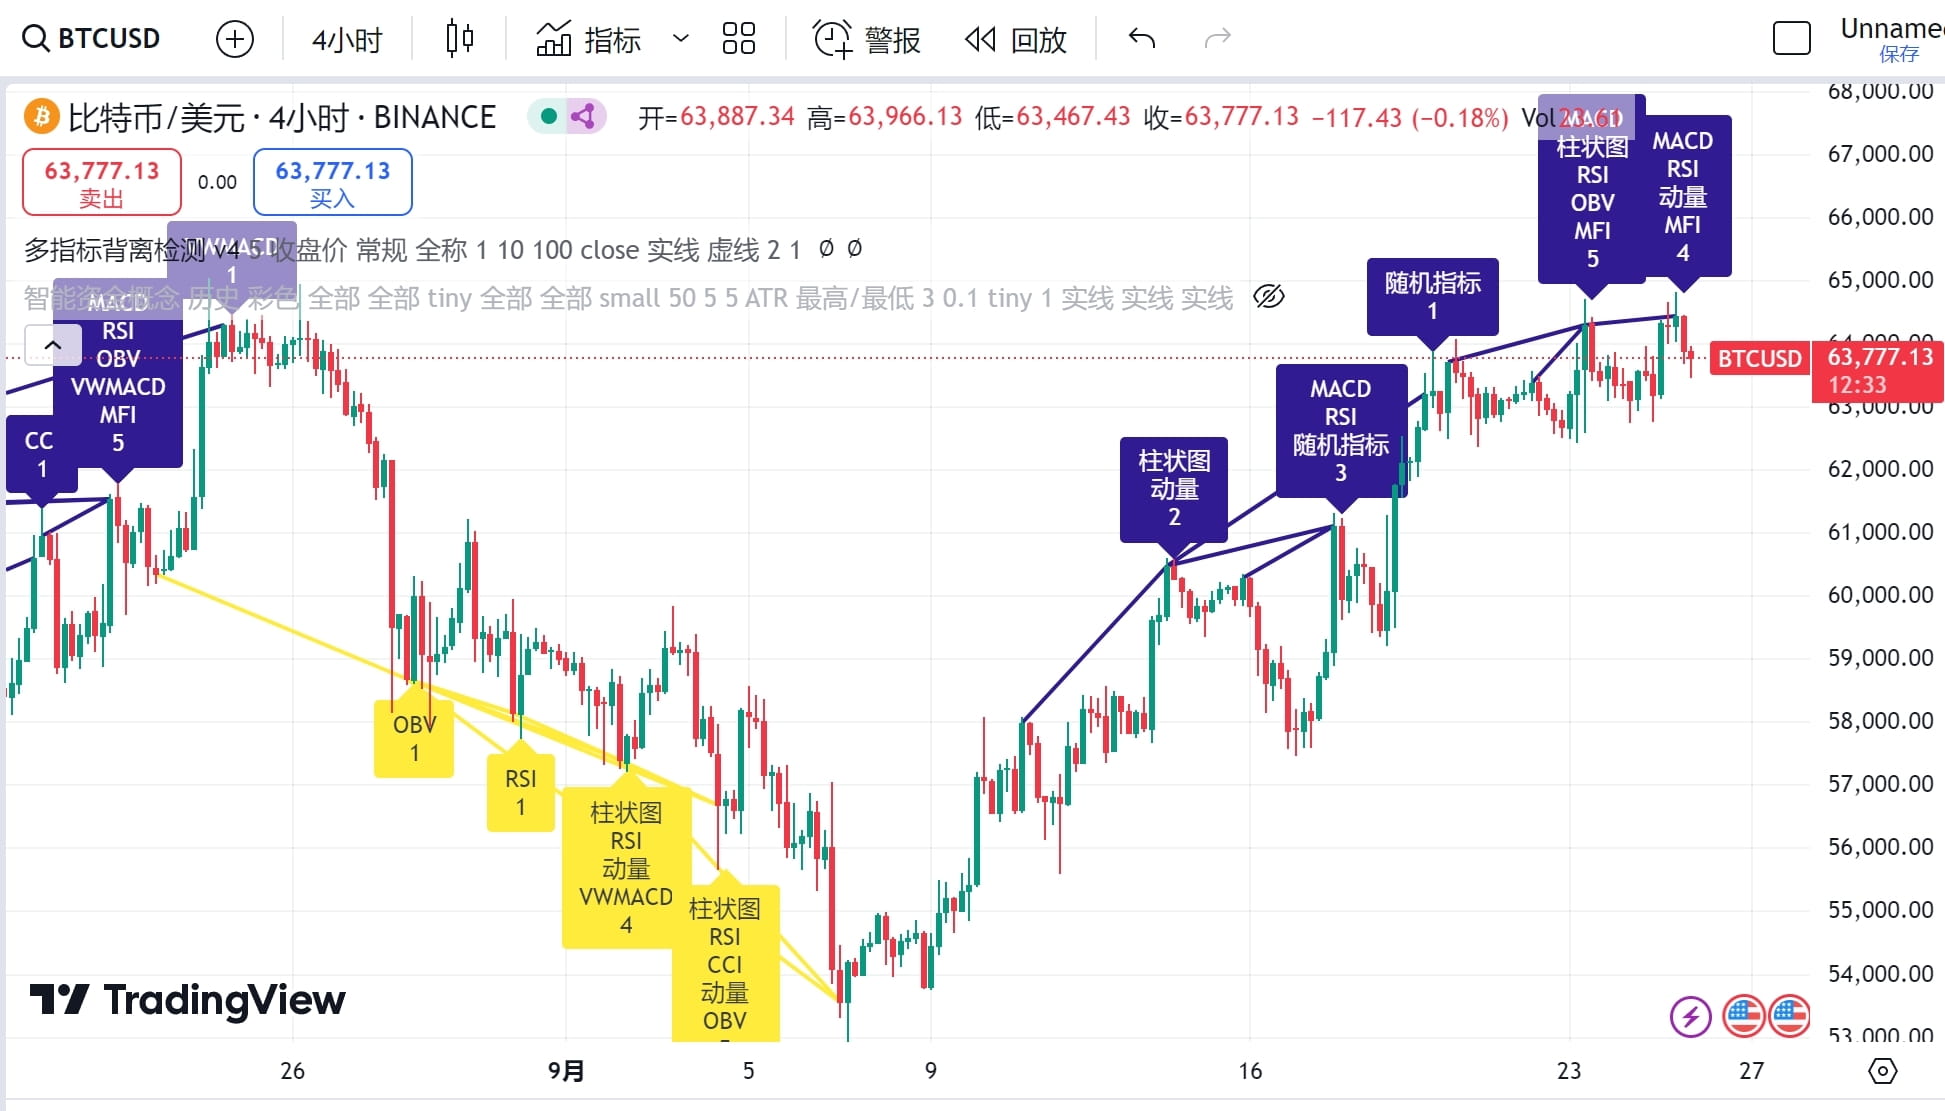
First, let's look at the tips on the top and bottom divergence of multiple indicators. Here we can see that there are multiple divergences at the 4-hour level. Of course, this is only for reference, because in the process of unilateral decline, it will also prompt bottom divergence at the wrong position. Therefore, indicators are not omnipotent.
Then let’s look at the divergence at the daily level.
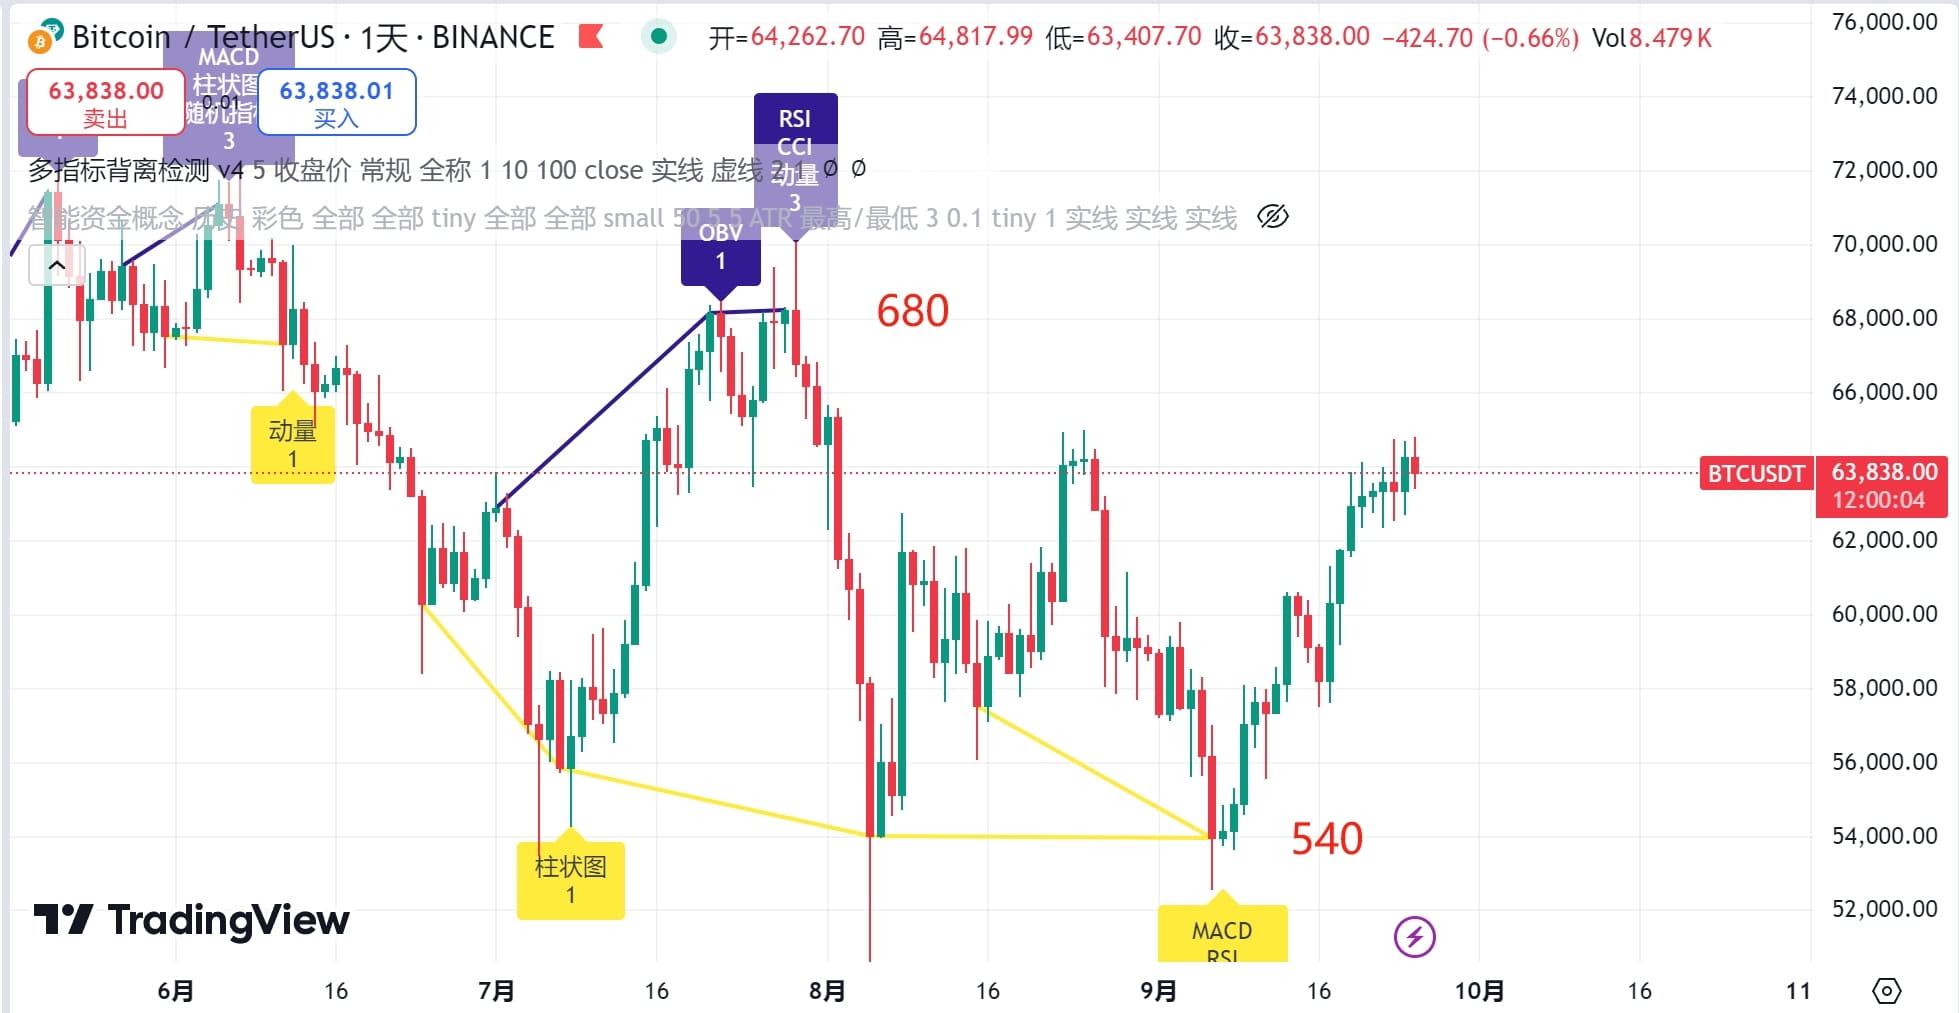
The daily level divergence has significantly reduced errors. You can see several prompts, and there are no major problems. The top divergence starts from 680, and the bottom divergence has a small difference at around 540. This has a lot to do with the calculation of the closing price, and it cannot capture the lowest price.
Then we will look at the performance in SMC.
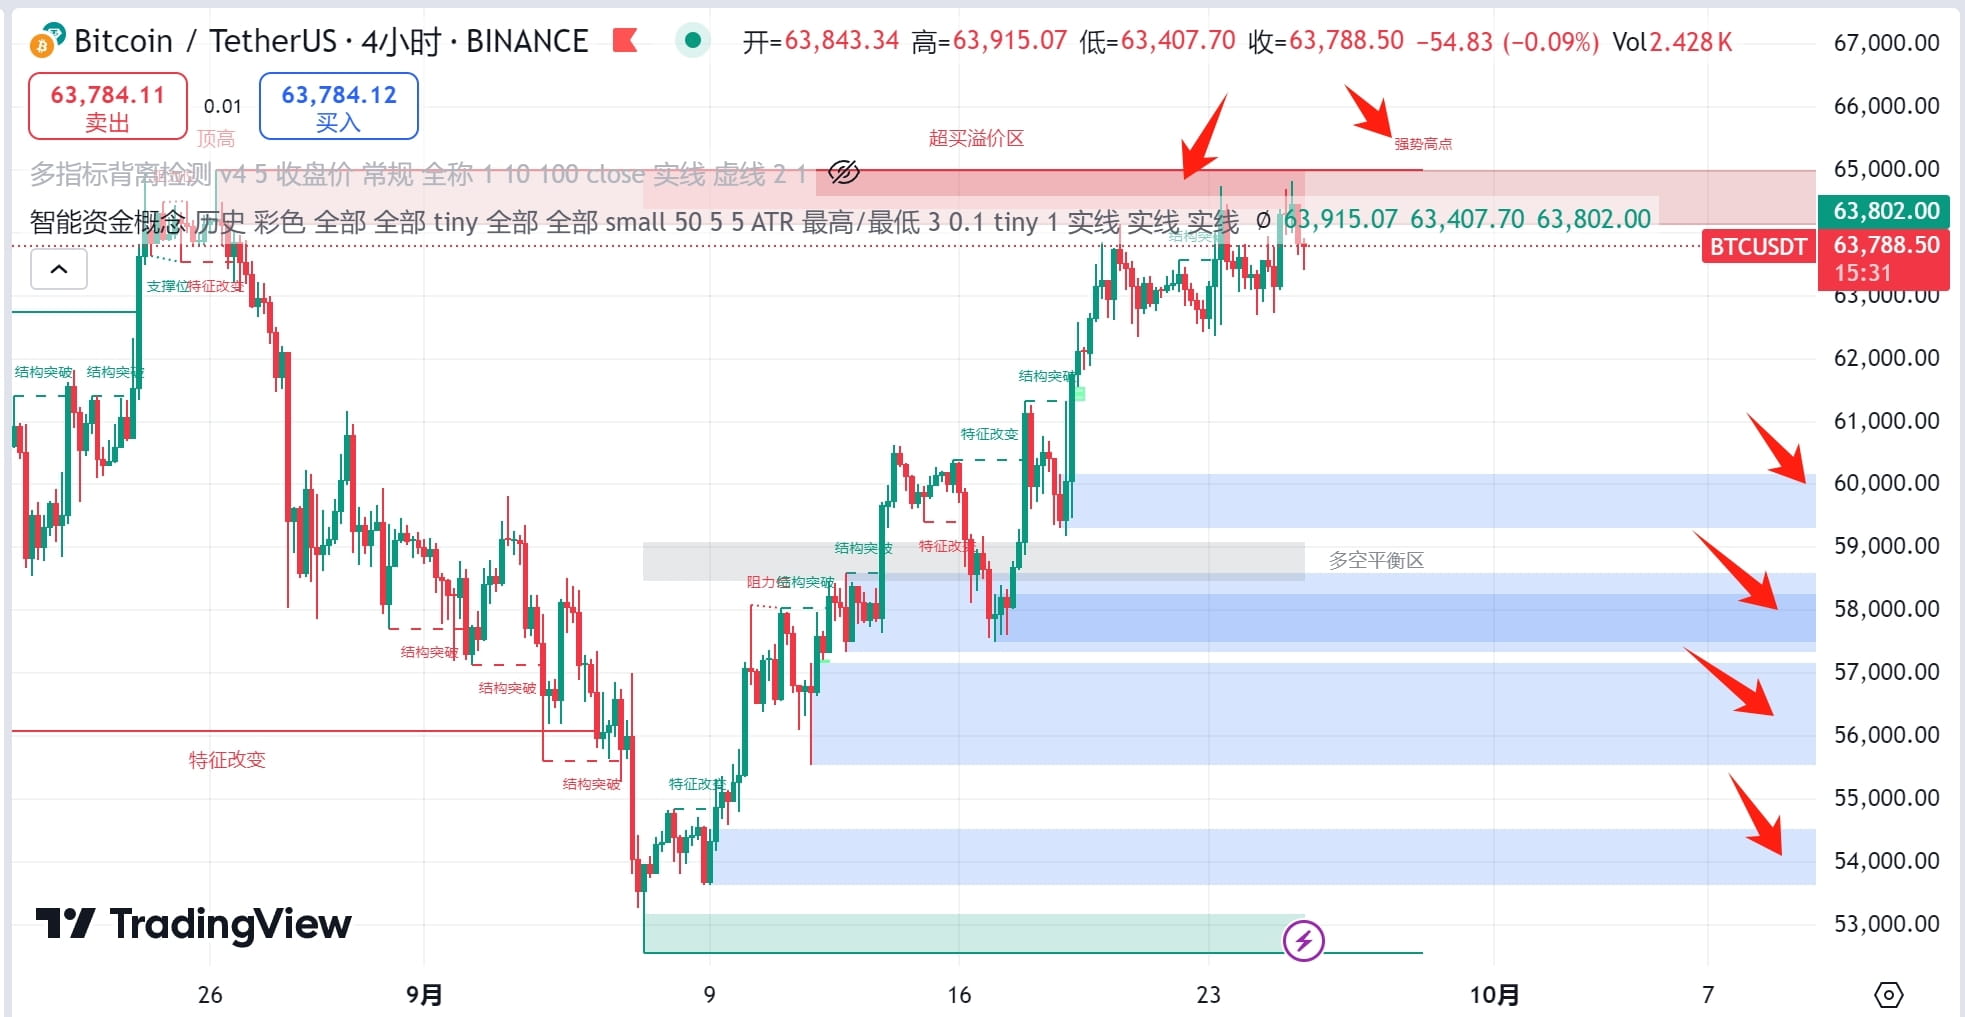
It indicates that the 650 above is an overbought premium and a strong high point (there is another relative high point below this, and the strong high point can be understood as a "cyclical peak"), and there is a dense overlapping area of sell orders (red area), which is also an important reason why we cannot break through. There is a section below that has no pending orders, and the actual pressure bearing capacity of this section will be weaker than expected. At the 4-hour level, the real pressure area is the blue area below. The 575-585 section is the strongest.
Then let’s look at the daily chart.
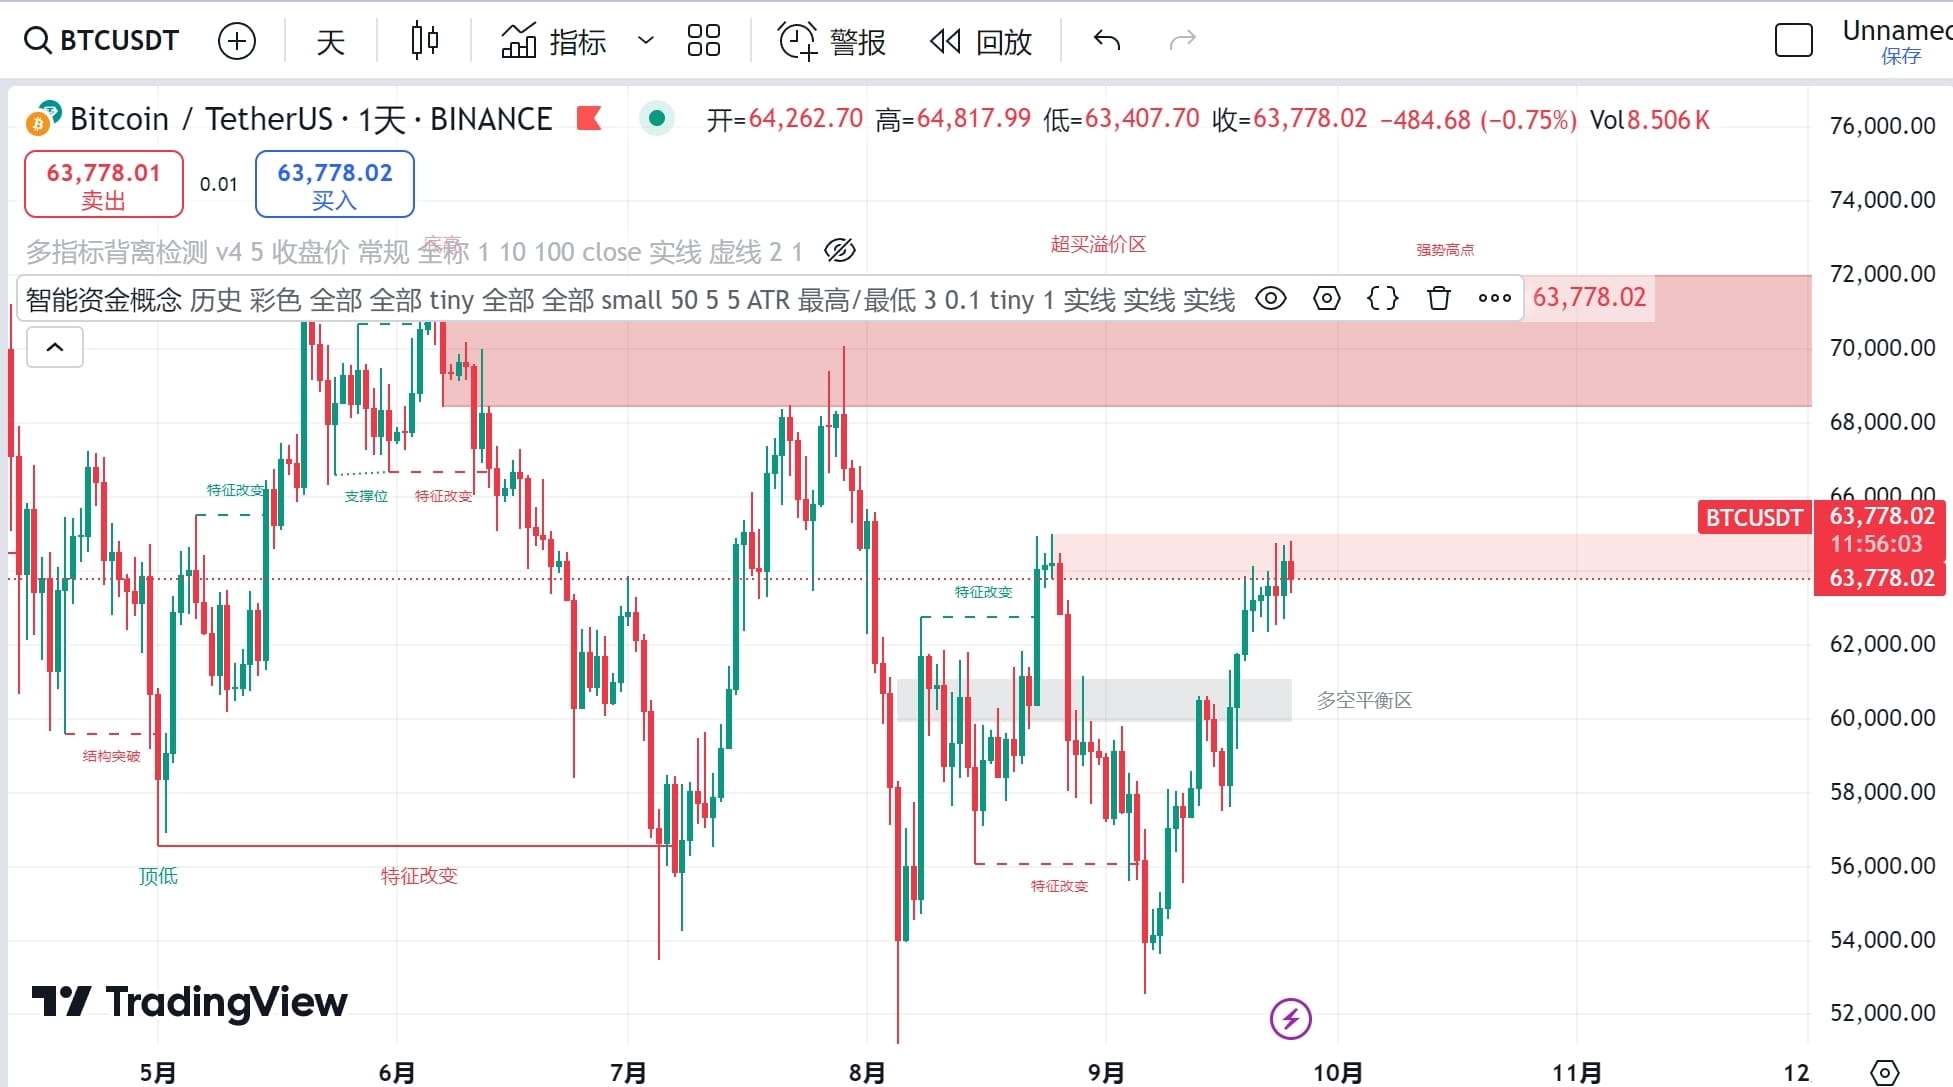
At the daily level, in addition to here, there is a dense pending order area, starting from 685 above and extending to 720, which is also a wide dense selling order area. The buying and selling balance area (long and short energy balance) appears in the 600-615 section.
Finally, let’s take a look at the shape after removing all indicator assistance.
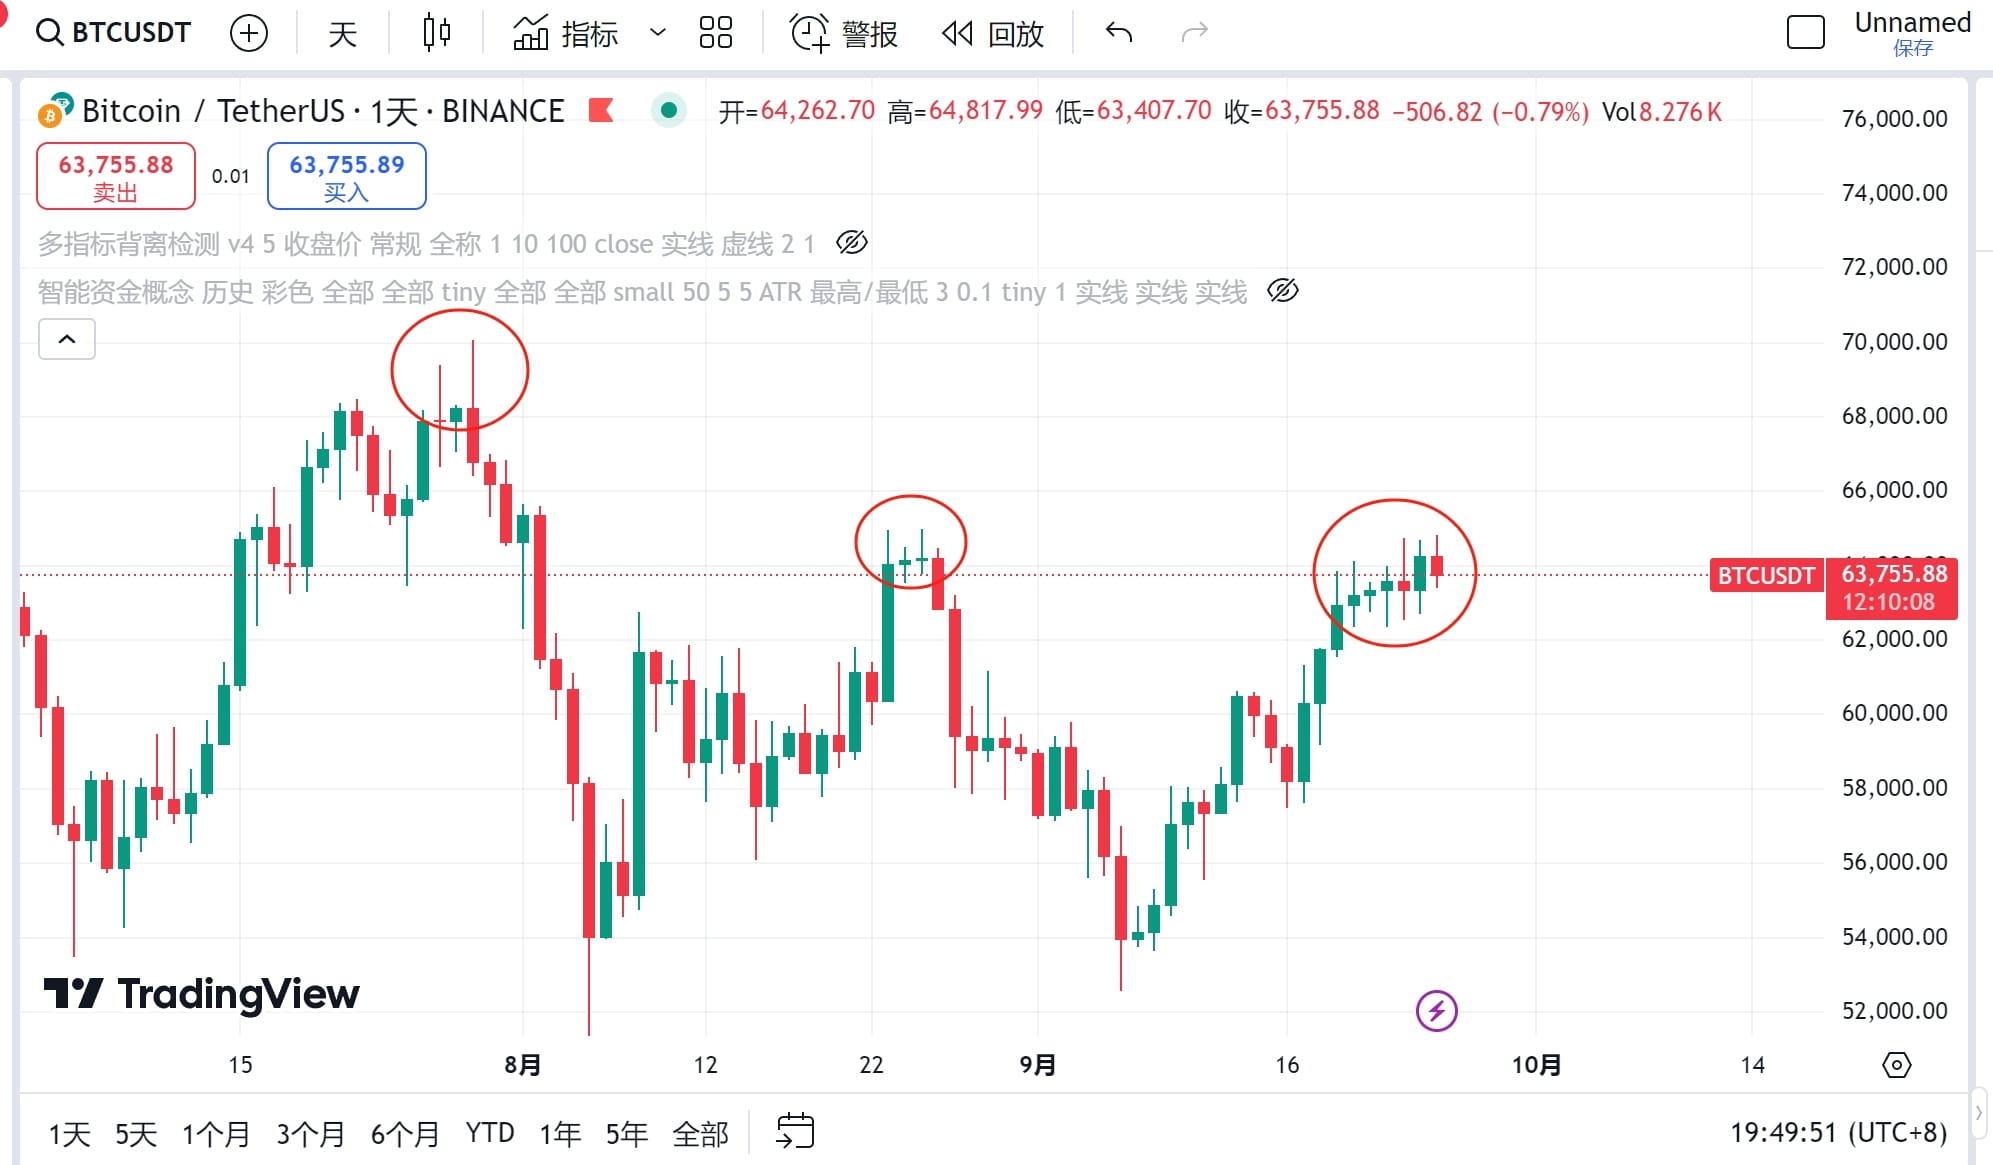
If you must understand that this is the bottom rise, we have to continue to move upward, that's fine. The current situation is that the monthly line does not support prices above 650, and around 65,200 is the limit price that the monthly line can support. No one knows how long it can last, and no one knows whether there will be support after the Black Friday delivery. In my opinion, this is a short squeeze, forcing people to turn long, and what the result will be after turning long, I don't need to say. I support and affirm your point of view 100%, you can do it according to your own logic and thinking, don't refer to my opinion, or treat me as a "holy grail", I can only put forward my point of view. No one can confirm that this point of view is definitely correct. All market analysis is actually speculation, it just depends on the probability of occurrence.
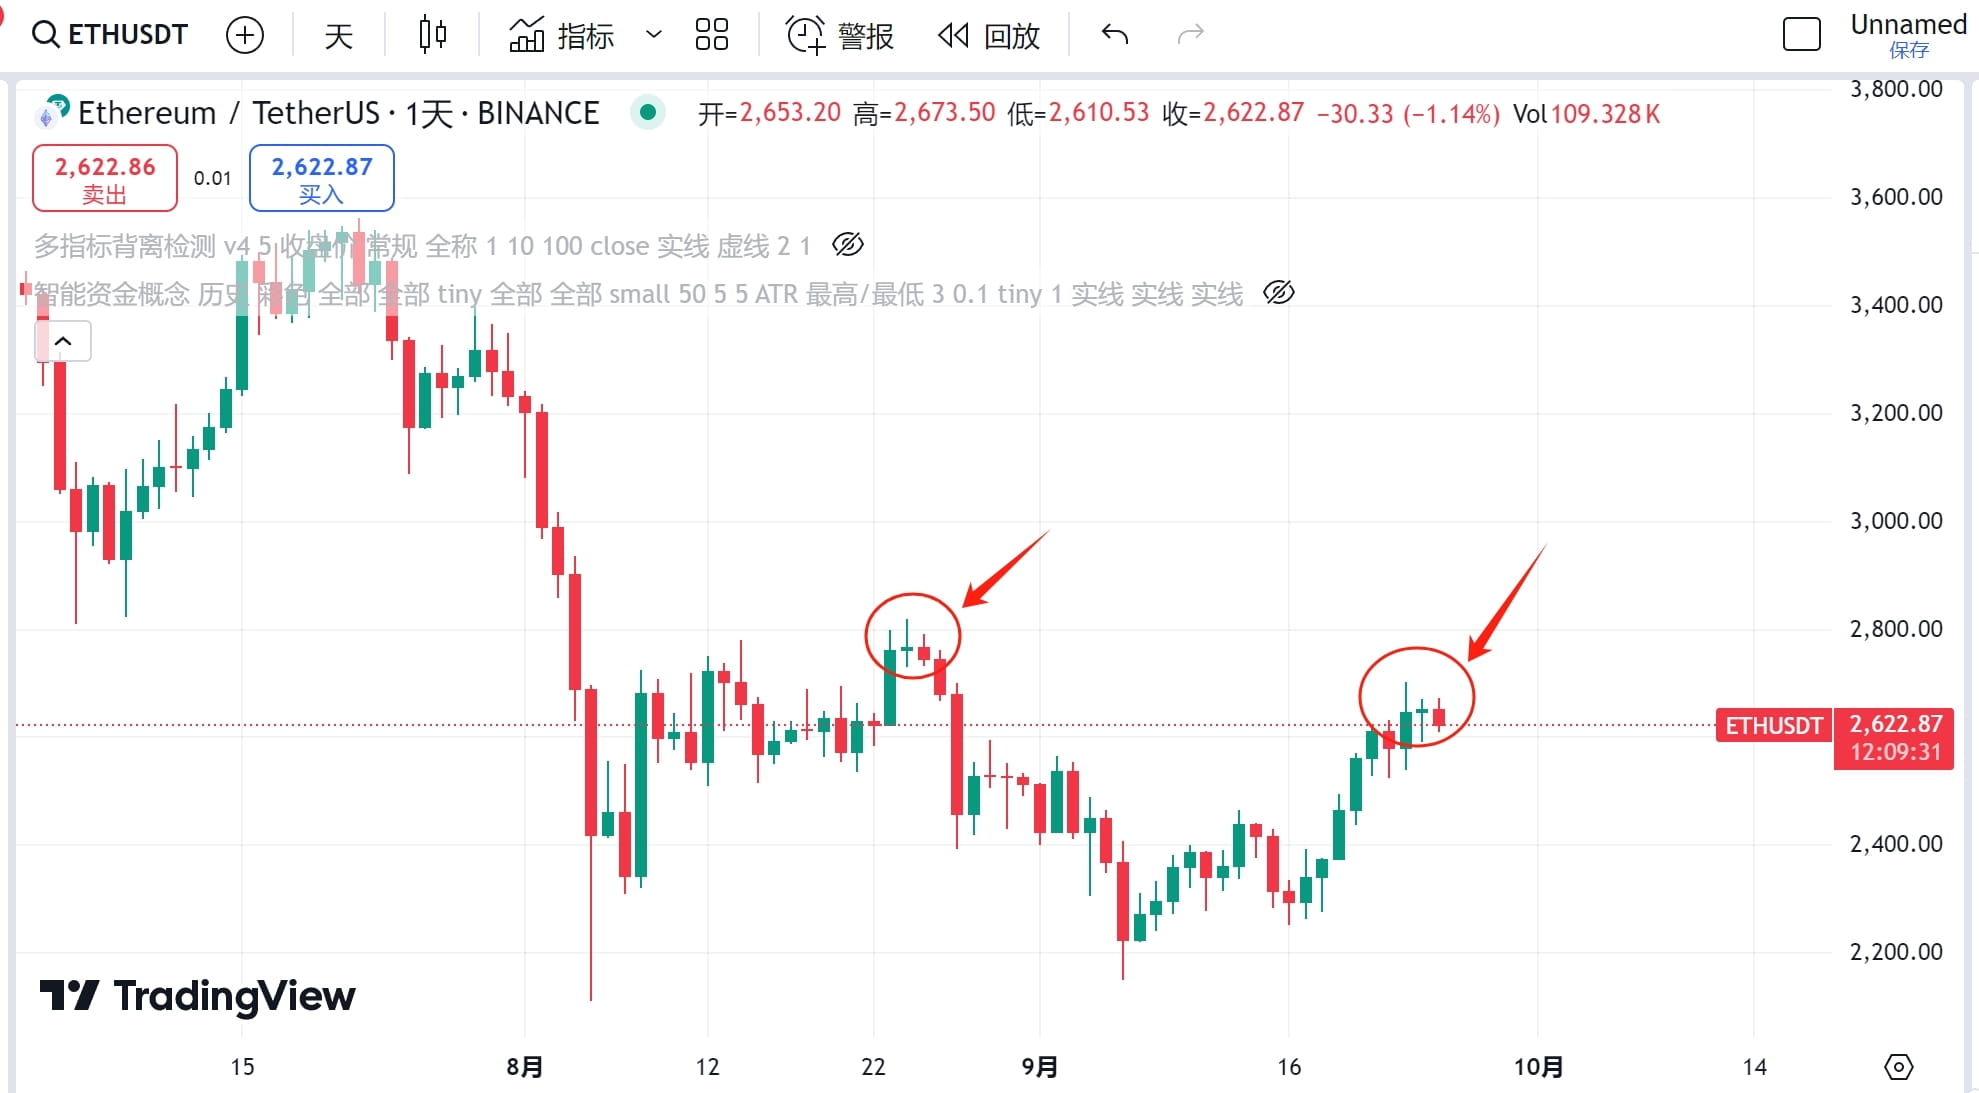
Continue watching $ETH
We still start with the divergence situation
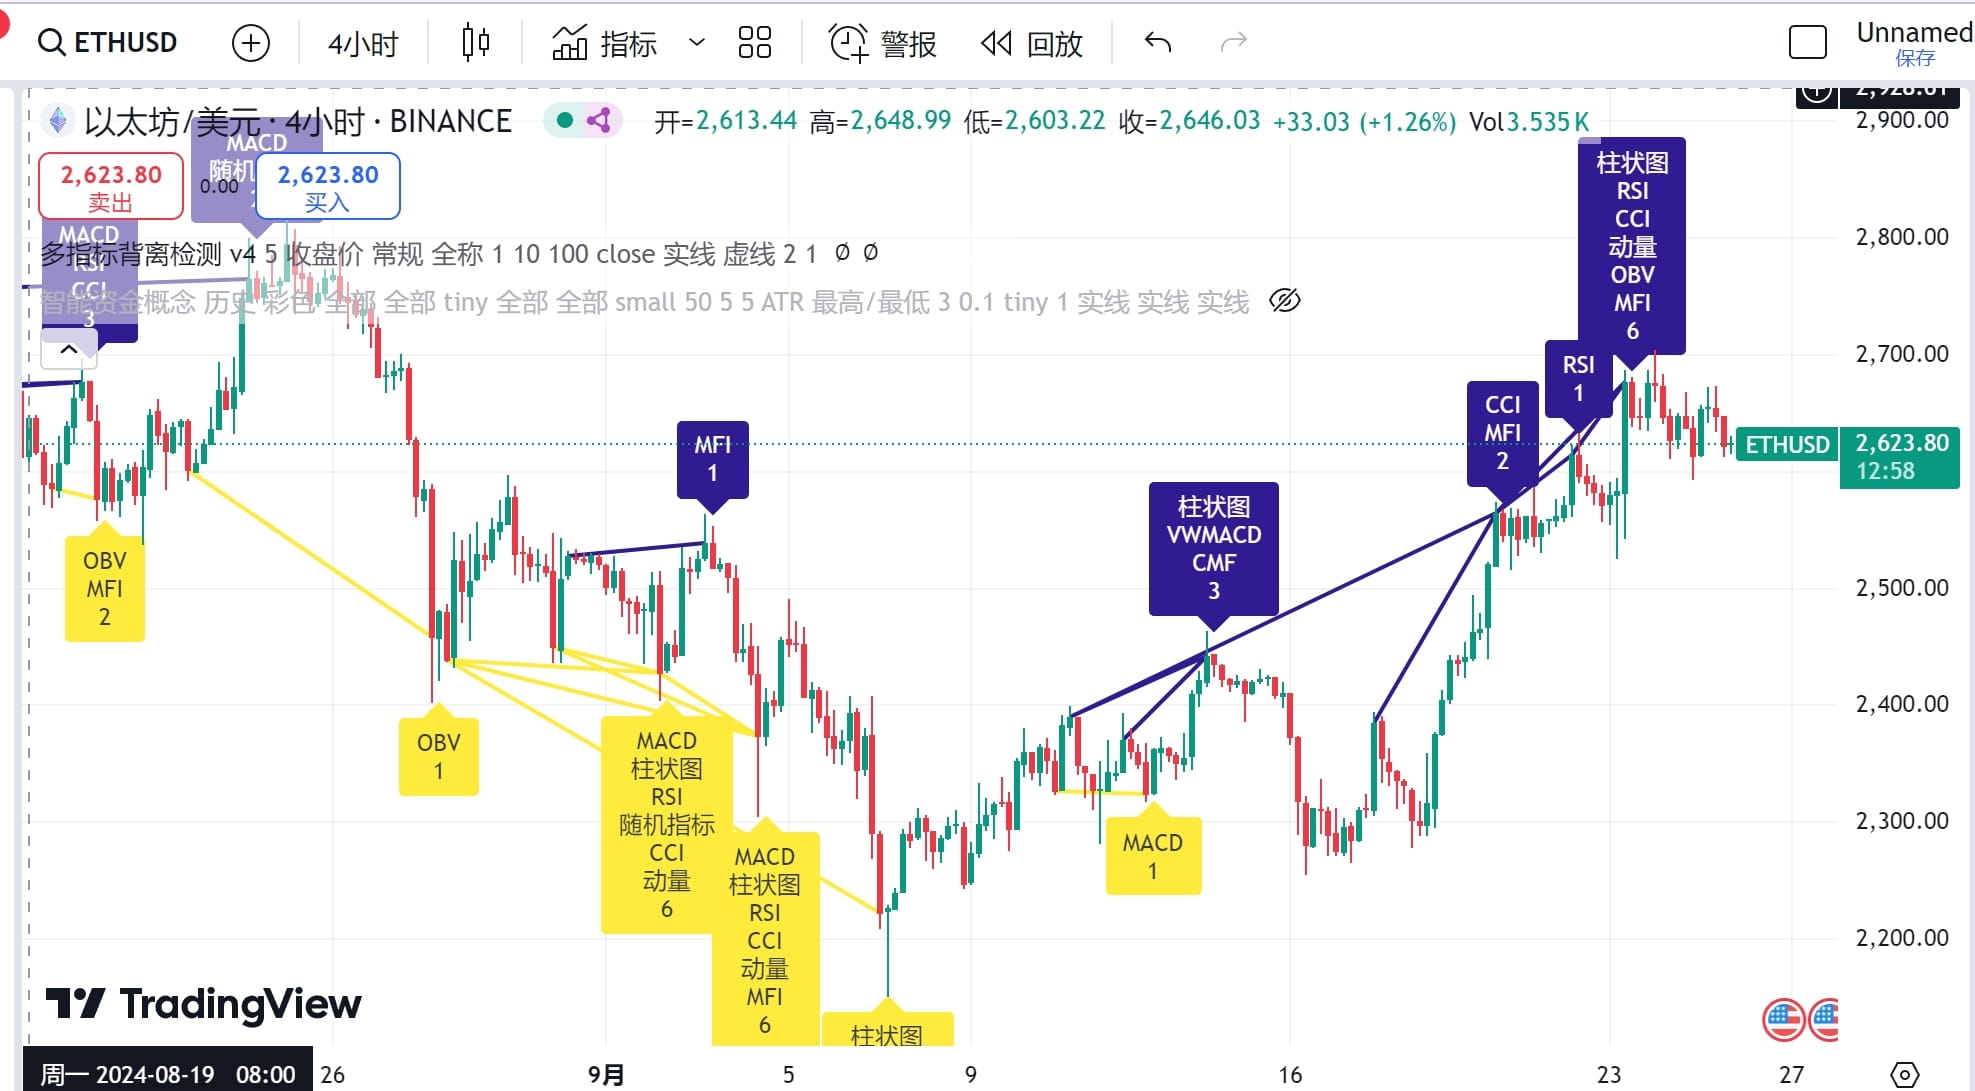
4-hour level divergence, the last divergence is at 2680. Let me explain the meaning of divergence here. It means that the price is rising, the price is getting higher and higher, and the moving average is also rising all the time, while the auxiliary indicators (whether it is macd, rsi or other indicators) indicate that the trend is decaying or downward, that is, it is falling all the time. For example, the peak of macd has a lower volume column, or the moving average is downward. This situation is called top divergence, and conversely, it is called bottom divergence. Most of the time, the top and bottom divergence indicates that there is a divergence between the current price and the actual price. You can understand that in this form, the price often has a large reverse fluctuation. Therefore, the top and bottom divergence indicators are used to judge and infer the top and bottom situations most of the time.
Look at the daily level
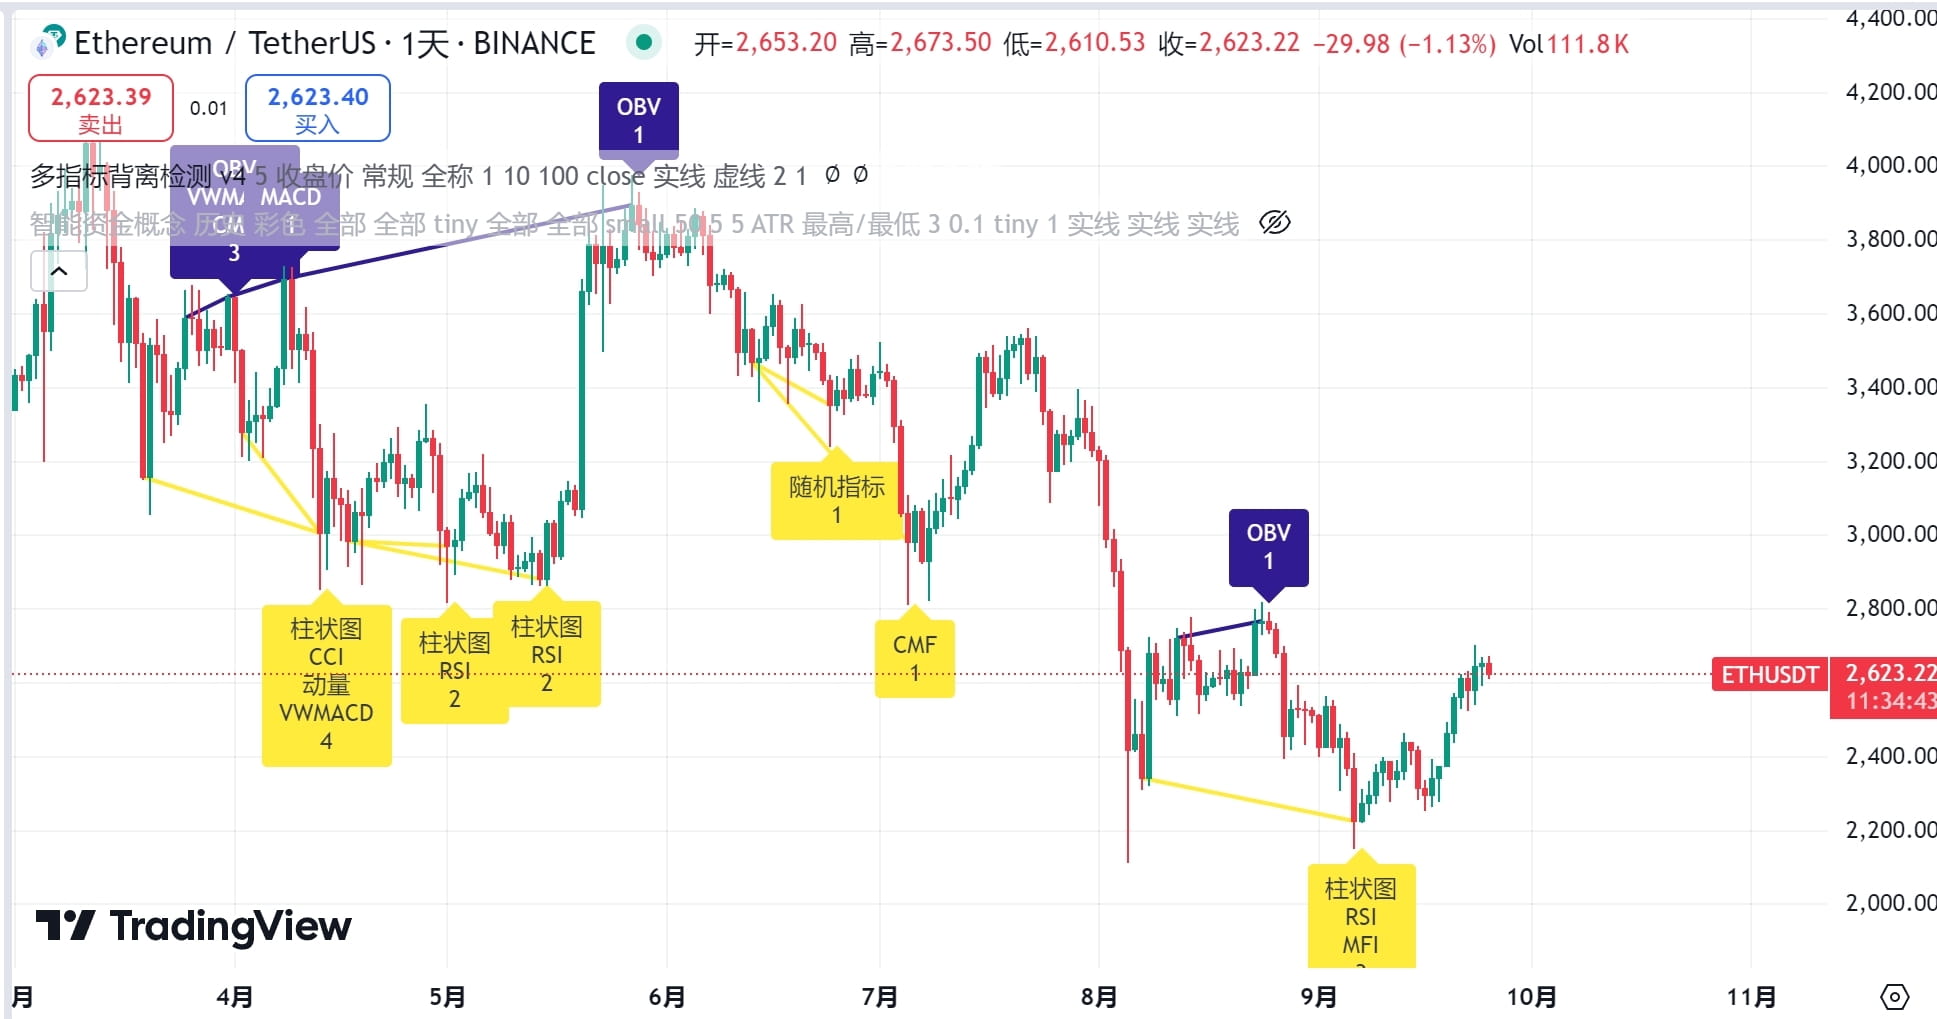
It is still the divergence at the daily level, which is relatively accurate, but it is still impossible to accurately infer every potential reversal. Therefore, if you use the divergence fixedly, you may still miss the opportunity to "escape the top". Therefore, this also needs to be viewed in combination with different time periods. When you feel that the price is not running right, remember to switch the time level. For example, let's look at the smallest 1-hour time level.
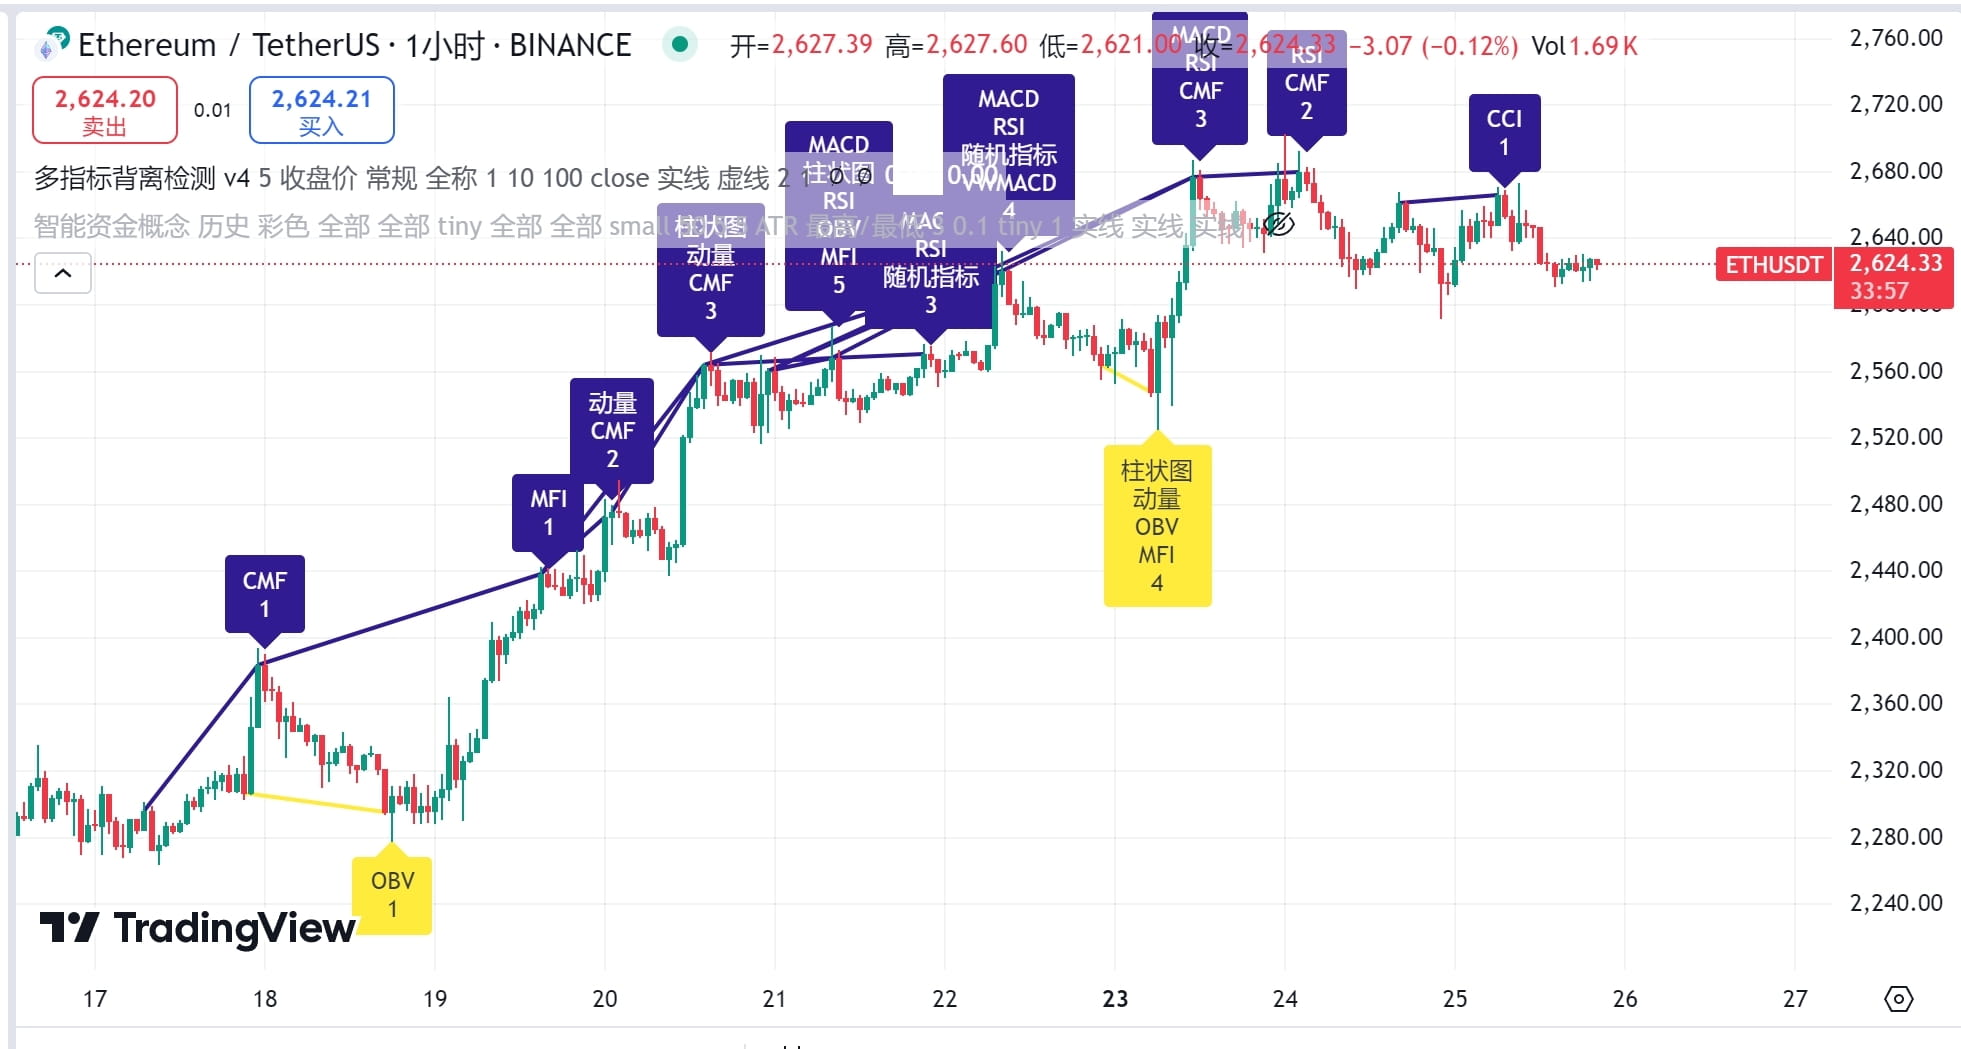
Here we can see that there are continuous divergences at the 1-hour level. In fact, divergences can also be understood as the price should not be like this. Or it can be understood as the result of strong control. In human language, the buying volume is weak and the trading volume is also weak, but the price is always rising. Just imagine how outrageous it is.
Then let's look at the performance on SMC
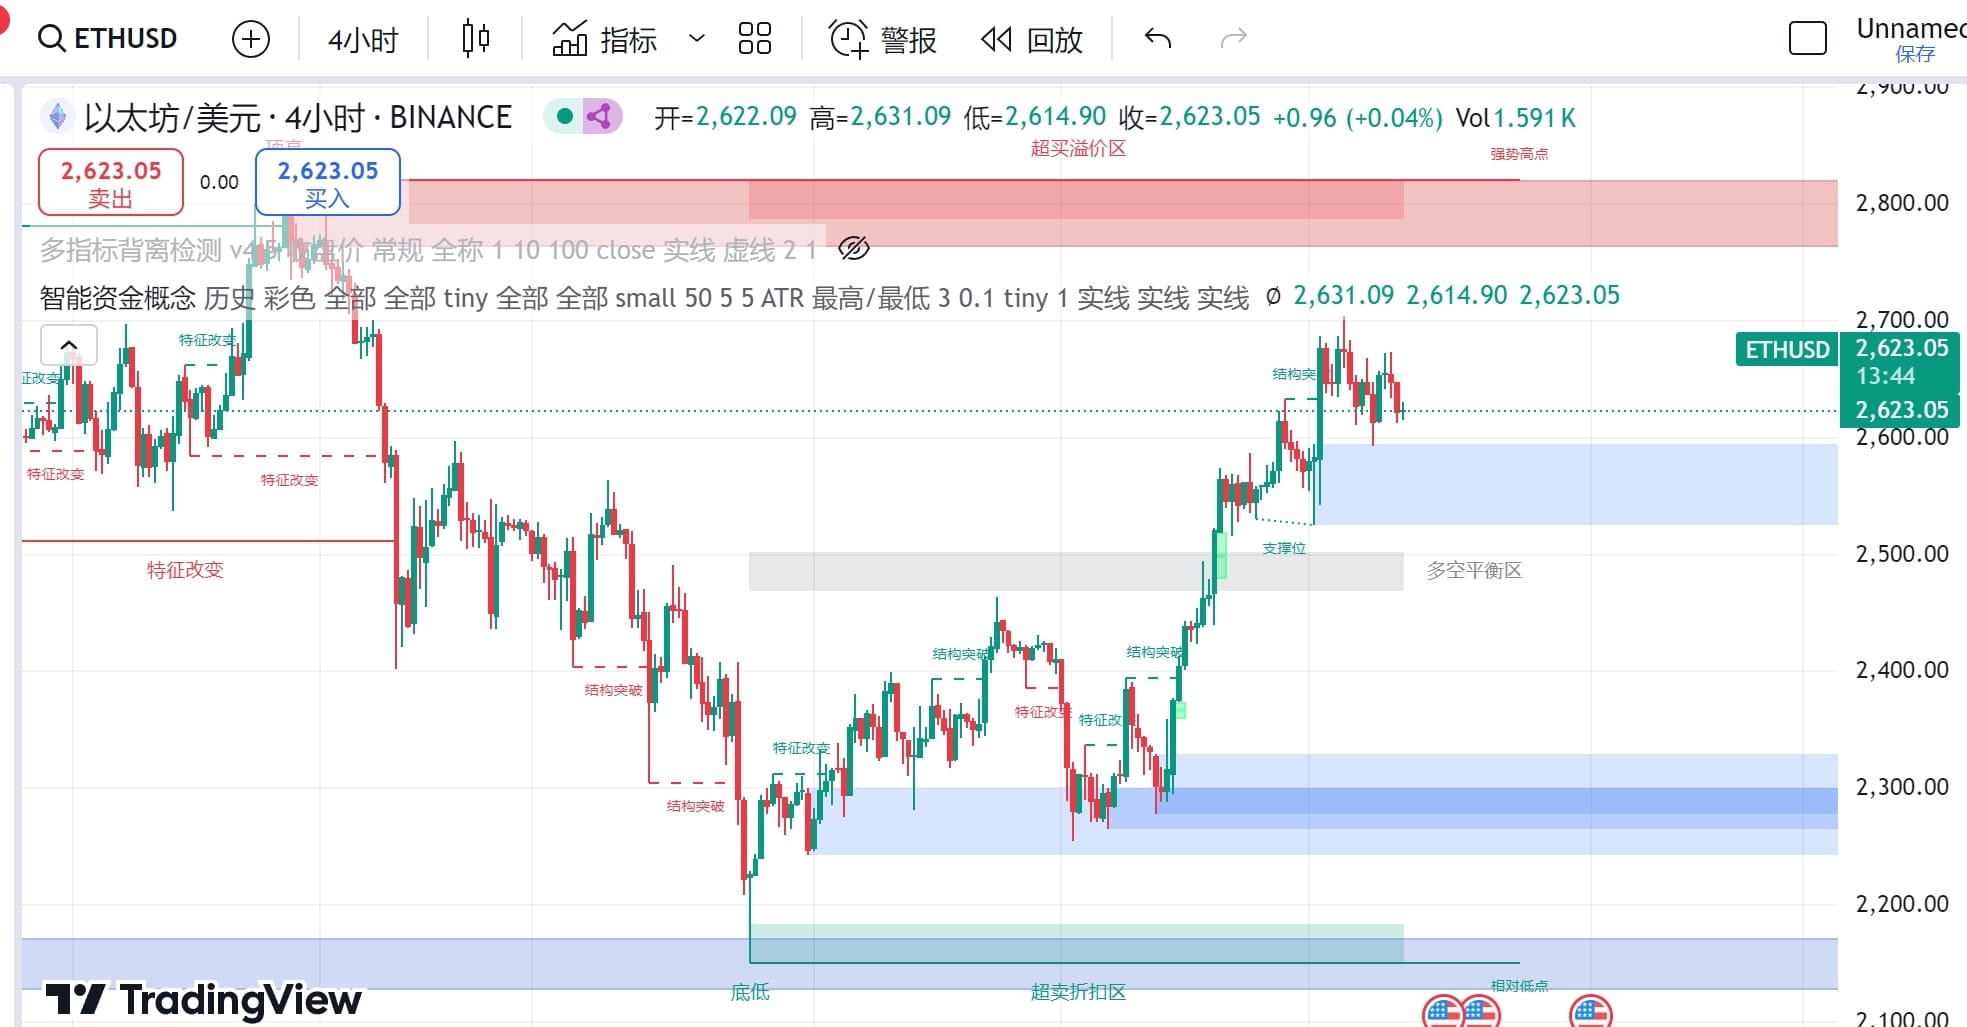
From the 4-hour level, we seem to be quite far away from the strong high point and oversold zone above, but what caused our price to stop running? There are two reasons. First, the new main force of Ethereum is not a "kind" main force. Every time he pulls up, he takes maximizing liquidation as the first purpose. After the last pull-up to 2823, no one thought that he could go directly back to 2150 from 2823, including the cat. This kind of open and close move has become very unfriendly. If novices continue to do Ethereum, the "tolerance rate" is actually lower than that of doing big cakes. At the 4-hour level, the oversold discount zone (bottom chips) price is 2146-2180, and there is also a dense buy order area above, at 2240-2329, among which the 2270-2290 section is the most dense, and the two order areas are superimposed. If a large callback occurs, the support of this section can be regarded as the strongest support. The long-short balance zone appears at 2480-2500 (in this section, the volume on both the long and short sides is nearly 50-50).
Then let’s look at the daily chart.
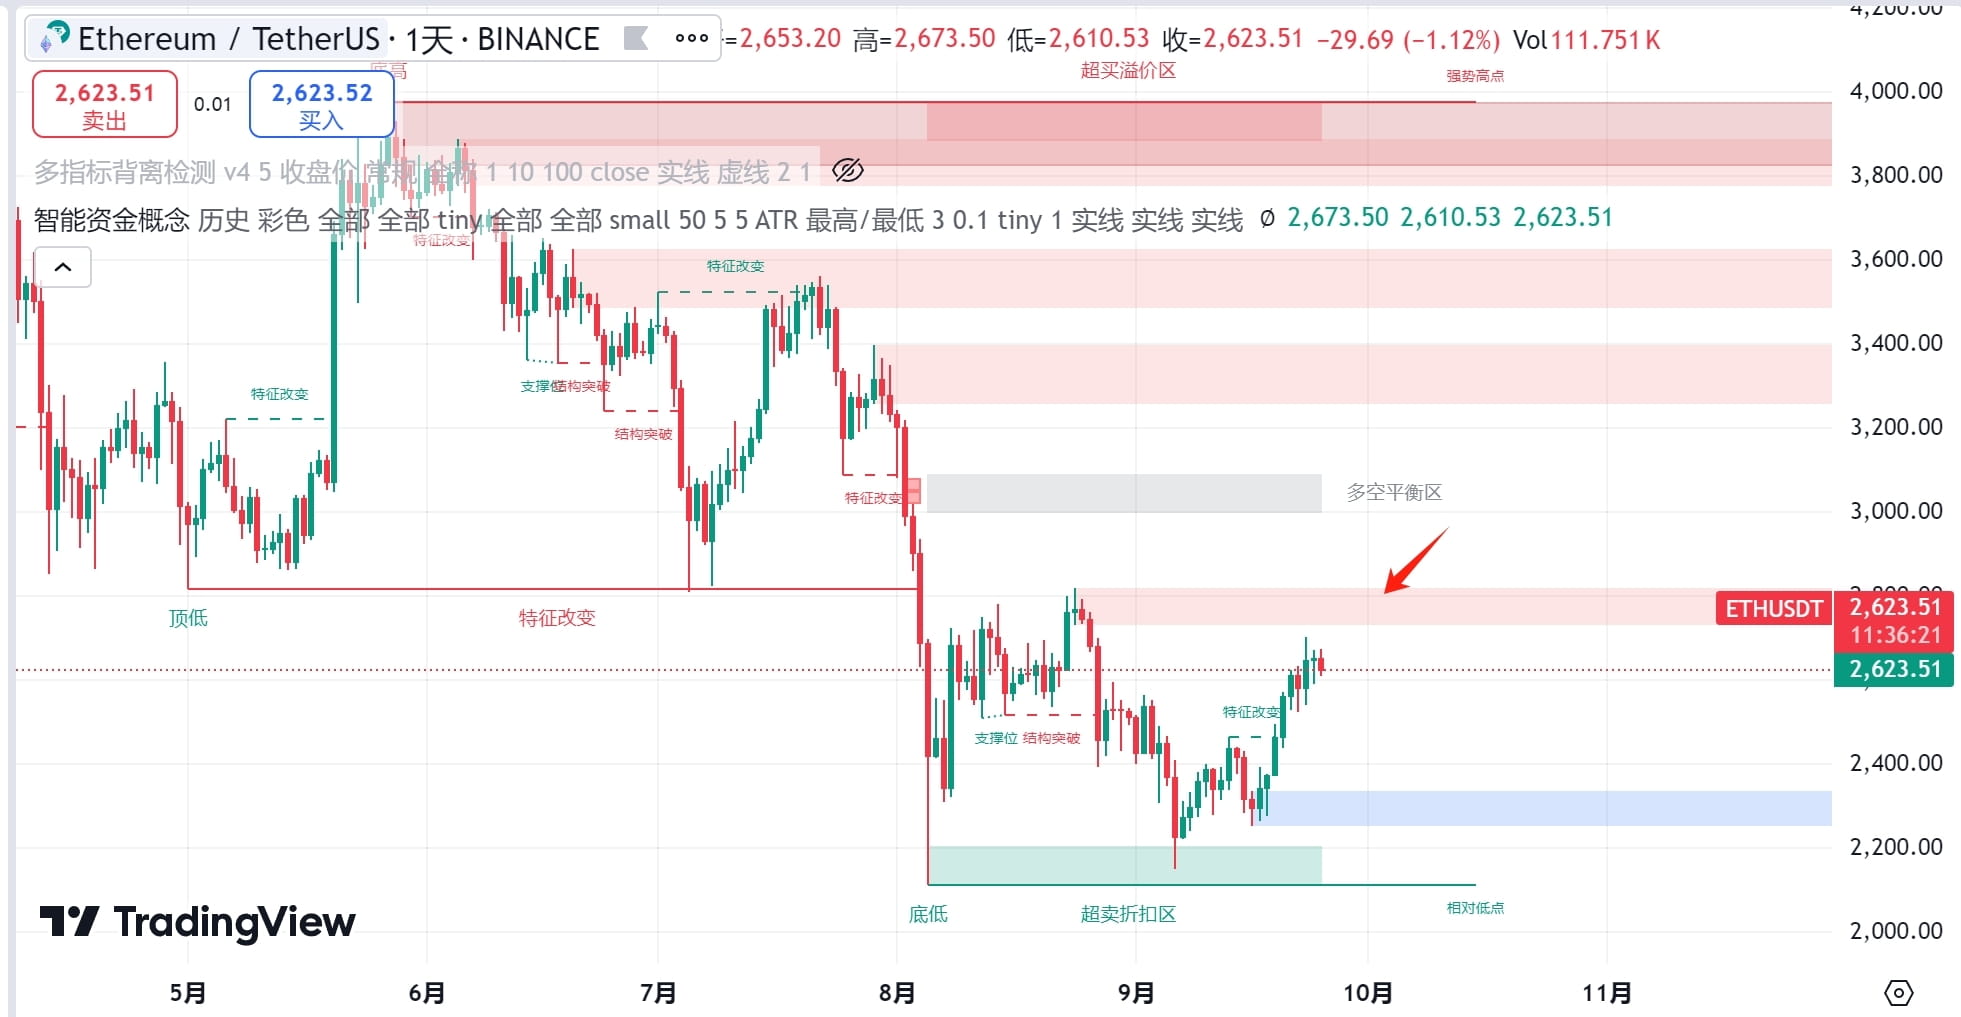
Here we can see the dense selling pressure on Ethereum, among which the sell orders are still the most concentrated in the 2800-2820 area. Looking at 3000, it is not out of reach, but for now, it is not visible. And Ethereum still has vague signs of drawing a door.
Why can't we go up any further?
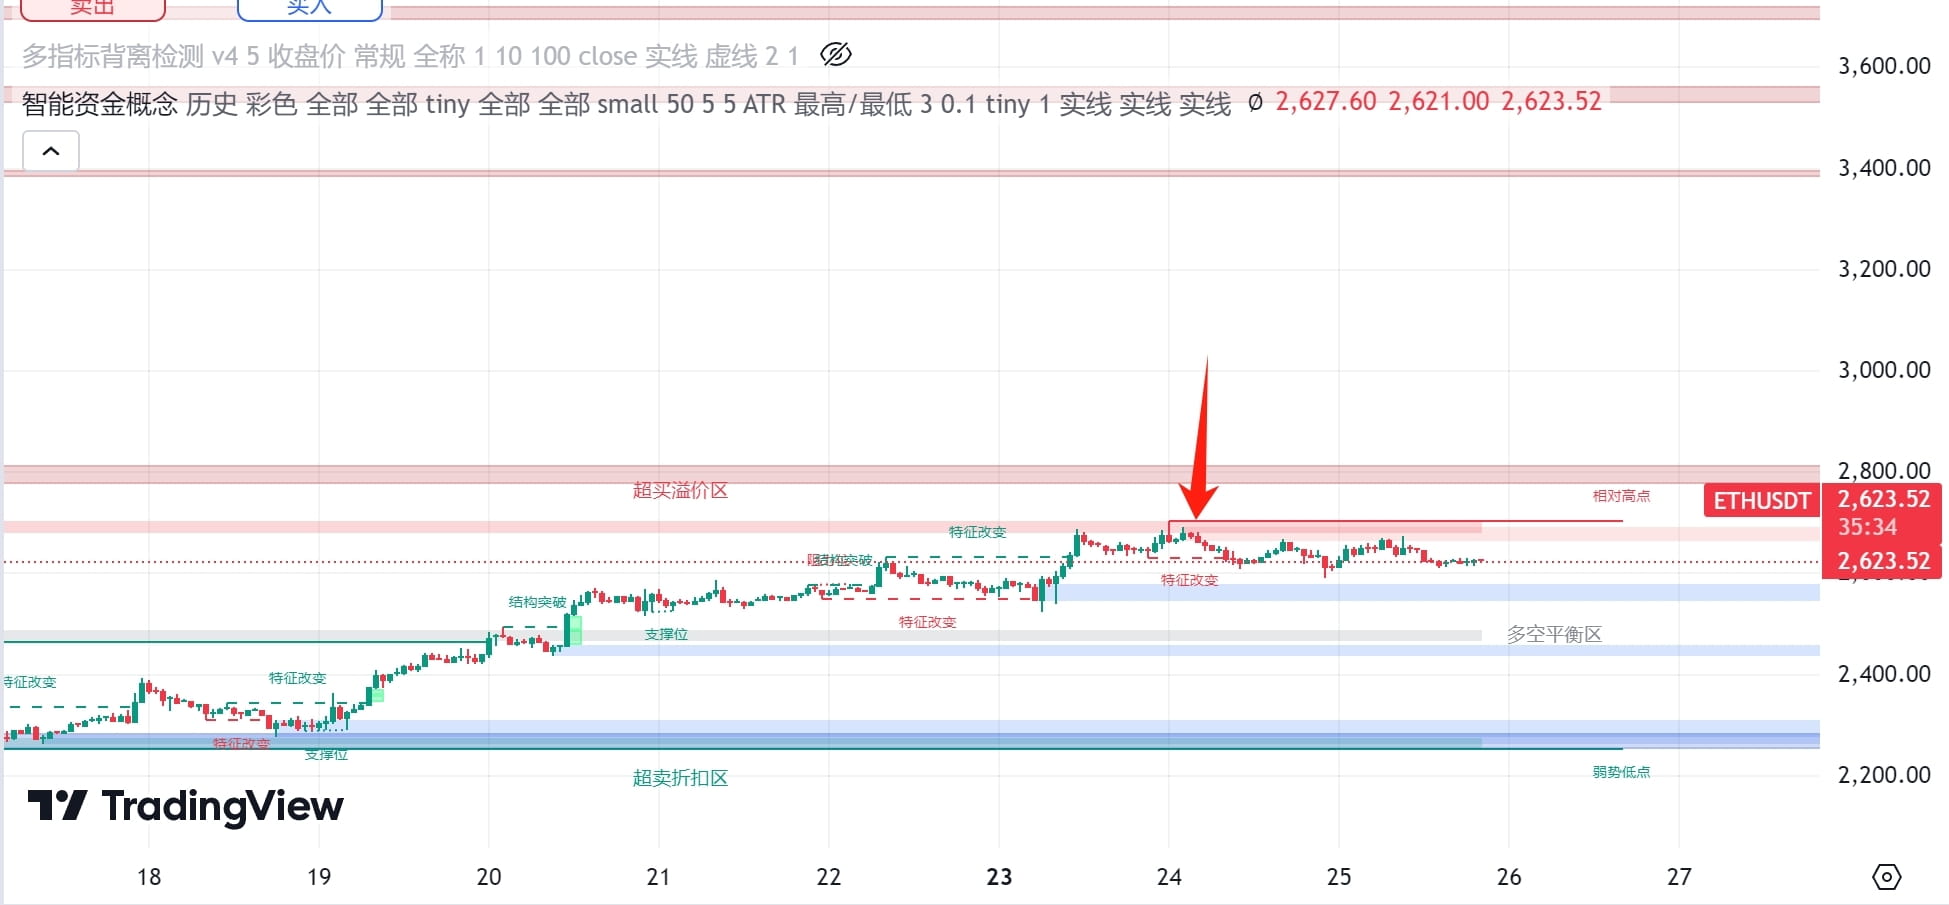
The reason why the price stopped going up is that there is a dense selling order here, and the two overlap, starting from 2660 to 2690, among which the order volume in the section of 2681-2701 is the most dense. If the main force does not take action, it will only slowly move downward. Before looking at the naked K, let's take a look at the liquidation of Ethereum.
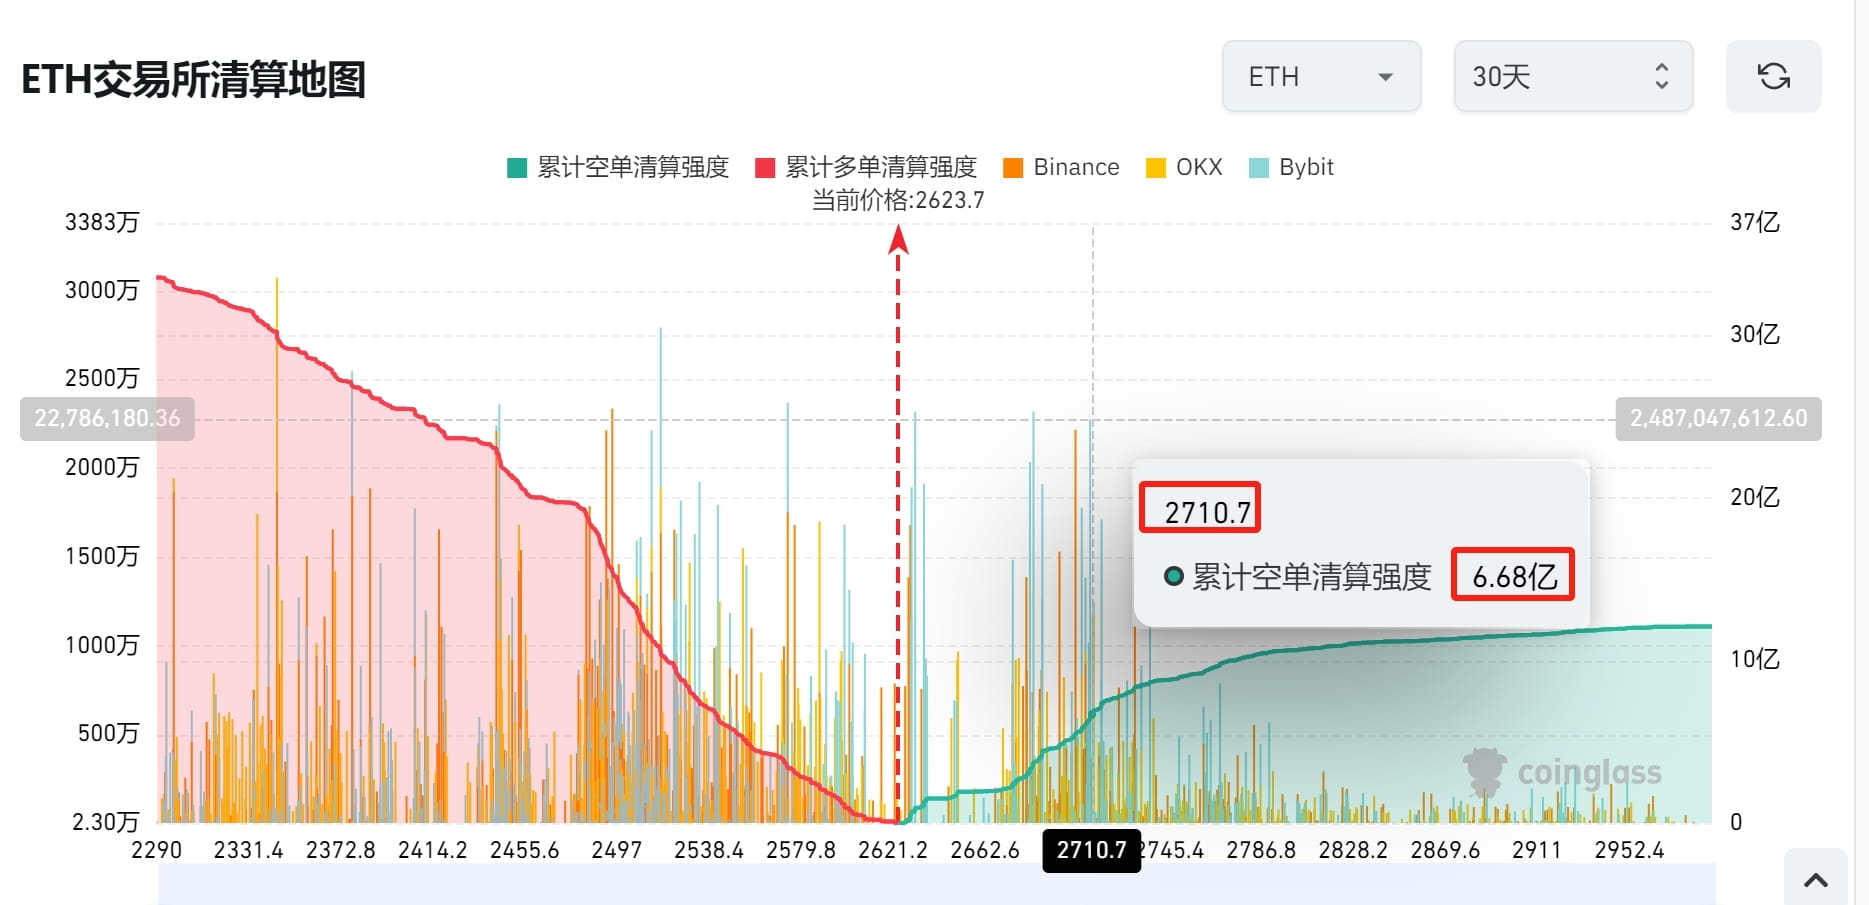
What does fuel mean? Fuel does not mean that if you open a 5x short order at 2600, you are fuel. It is very unlikely that you will be killed by 3120. Fuel refers more to those friends who are all-in 25x or more. For example, two days ago, they just went to 2700 and cleared all the short orders below 2700. Now there are friends who are liquidated at 2710. Then you can calculate, even if he opened a short order at the previous low price of 2593, how much percentage can he bear? 4.5%, bingo! This is called fuel, and it will die if it is pulled a little. This is the fastest to be cleared. In fact, the liquidation chart tells us more that your liquidation price must not be in a dense liquidation area. How can it be called safe? If you clear 95% of the prices in the same direction as you and still cannot reach your liquidation price, then you are probably safe.
Finally, let’s look at the situation of naked K
Here we only look at the pattern. Friends, if you think this pattern is a consolidation upward pattern, I also support your point of view. After all, you are the only one who can be responsible for your own transactions. I will not let anyone take long at a high position. My point of view is always that you can miss out on opportunities and accept it. I do not accept the magnification of risks. If you must be trapped, it is always better to be trapped at a low position than at a high position.
I also support your view that Ethereum will be 10,000 next year. If you follow this view, then any price of Ethereum is now the floor price. I may not agree with your logic, but I will always support your actions. Do whatever you think of. I don’t want to delay anyone.
Next watch $SOL
Still start with the divergence
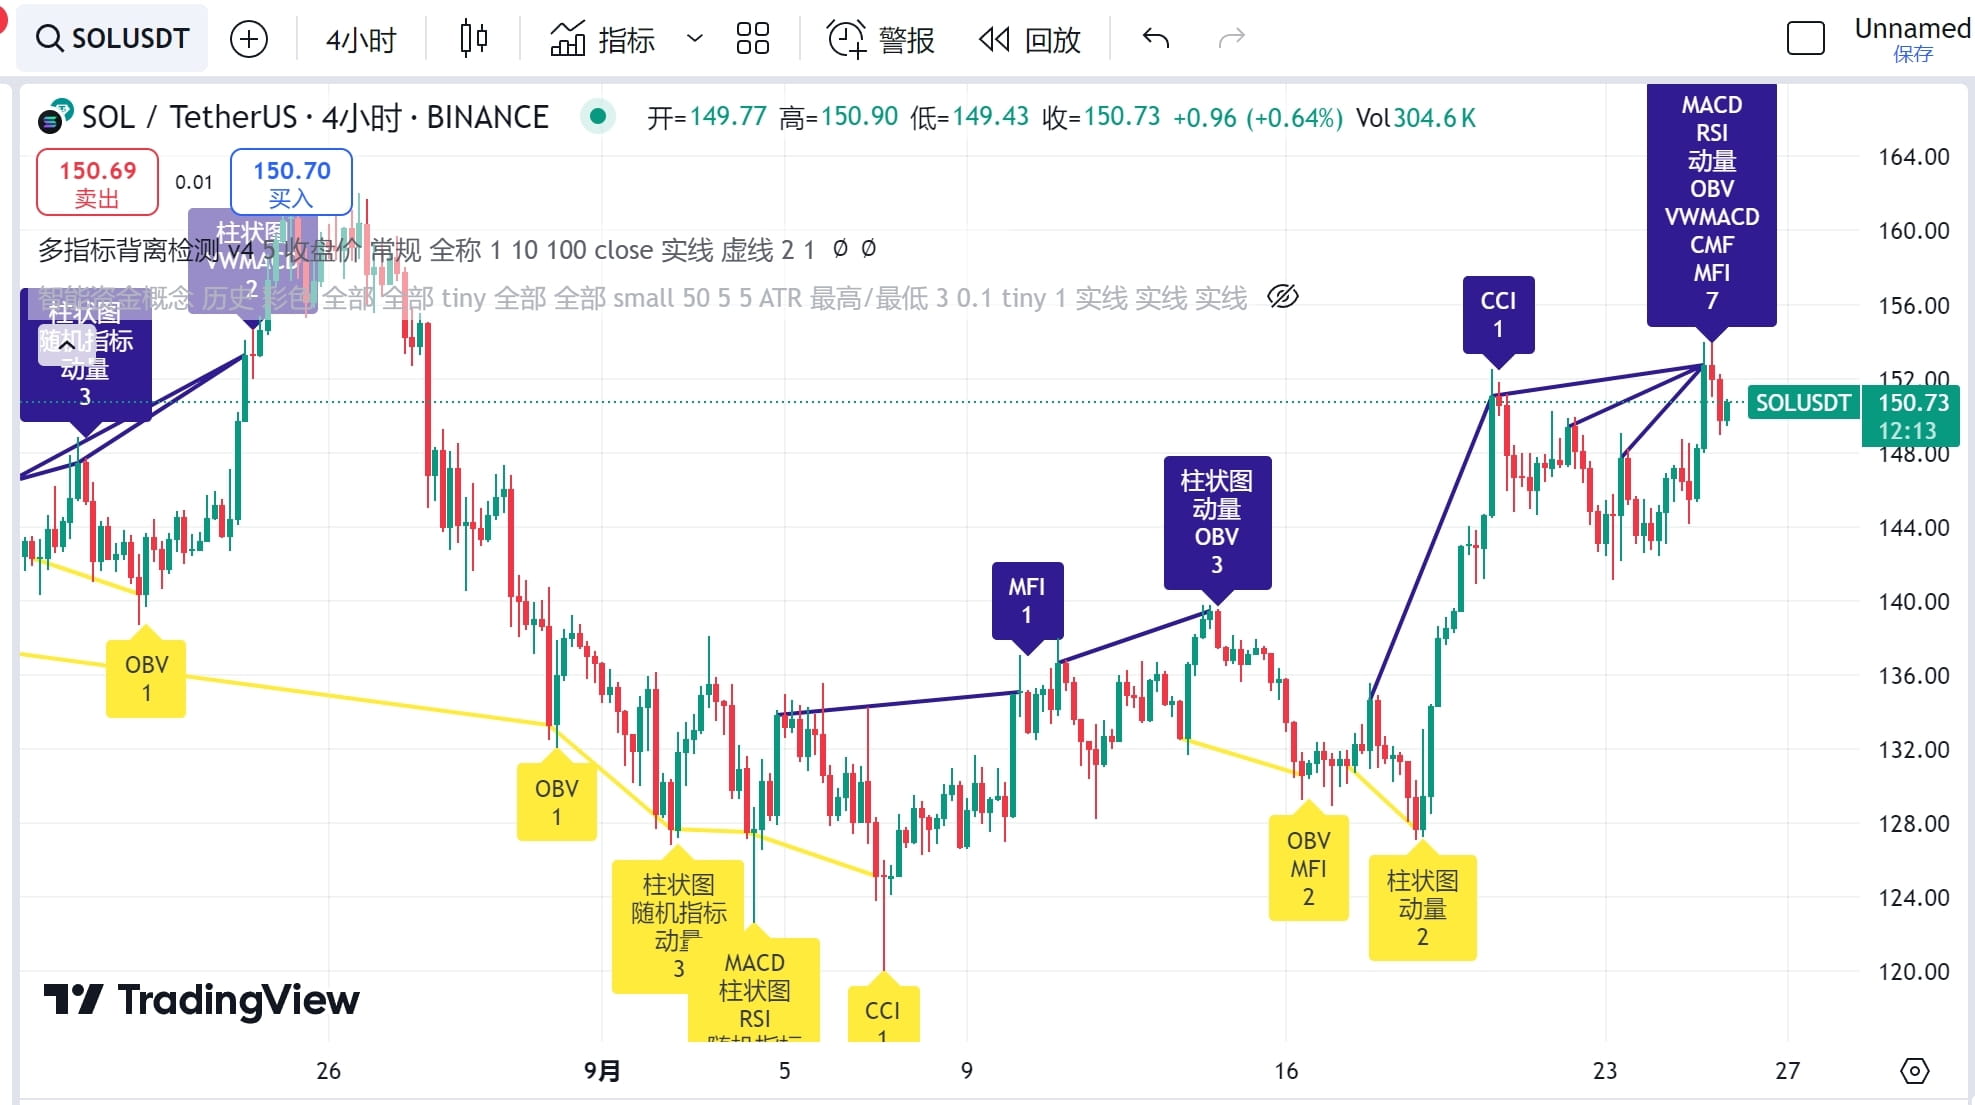
Sol's movement is relatively regular. The last divergence occurred at 151, and the bottom divergence occurred in the 128-132 period. Then let's look at the situation of SMC.
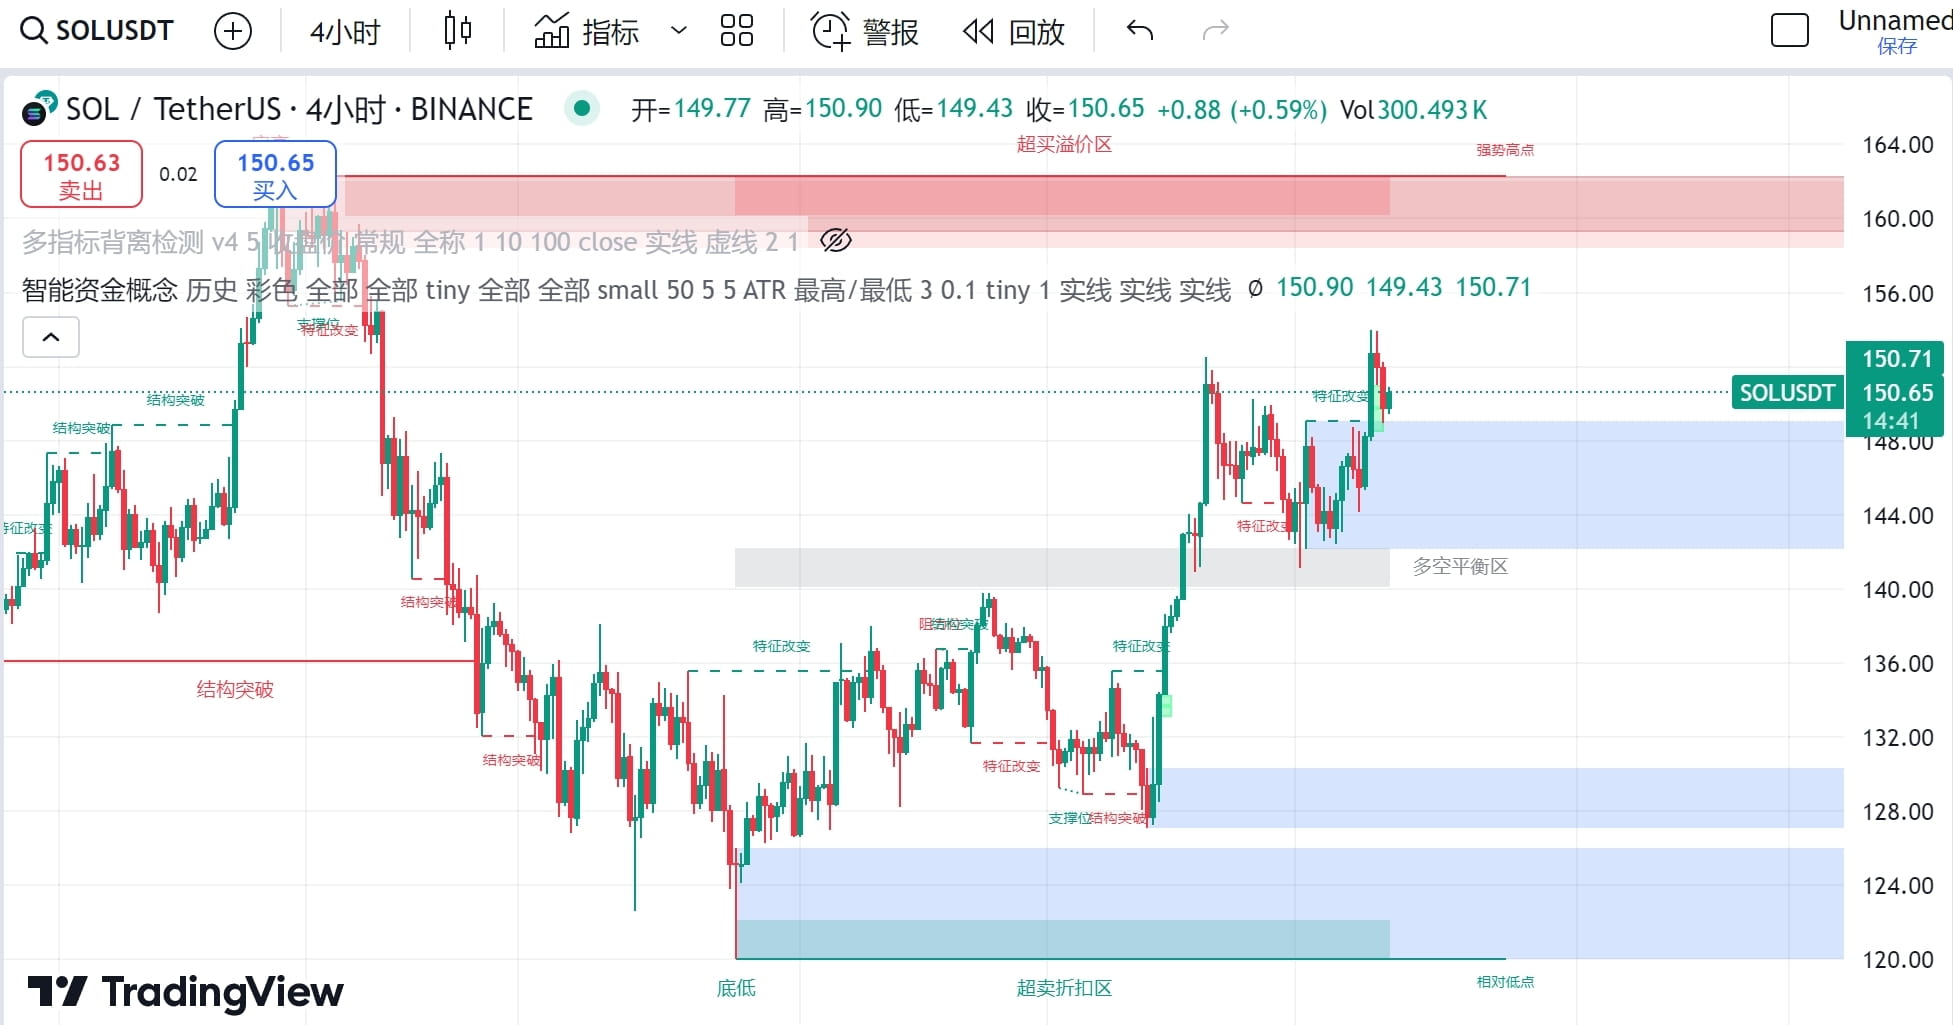
Because of the two failed attempts to reach the top, the 163 above has become a dense order area (locked area). There is a resistance level at 151-152 where the price fell and consolidated before. If the price wants to spiral up, it needs a major positive news. And the blue order area will also become a dense sell order area after the callback. This is the so-called: support and resistance exchange, or in other words, no position that can stop the price from running appears out of thin air. The long-short balance area appears at 140-143, which is also an important reason why the price can stop falling here before.
Where to buy the bottom? Look below, the chips in the oversold discount area are all good chips.
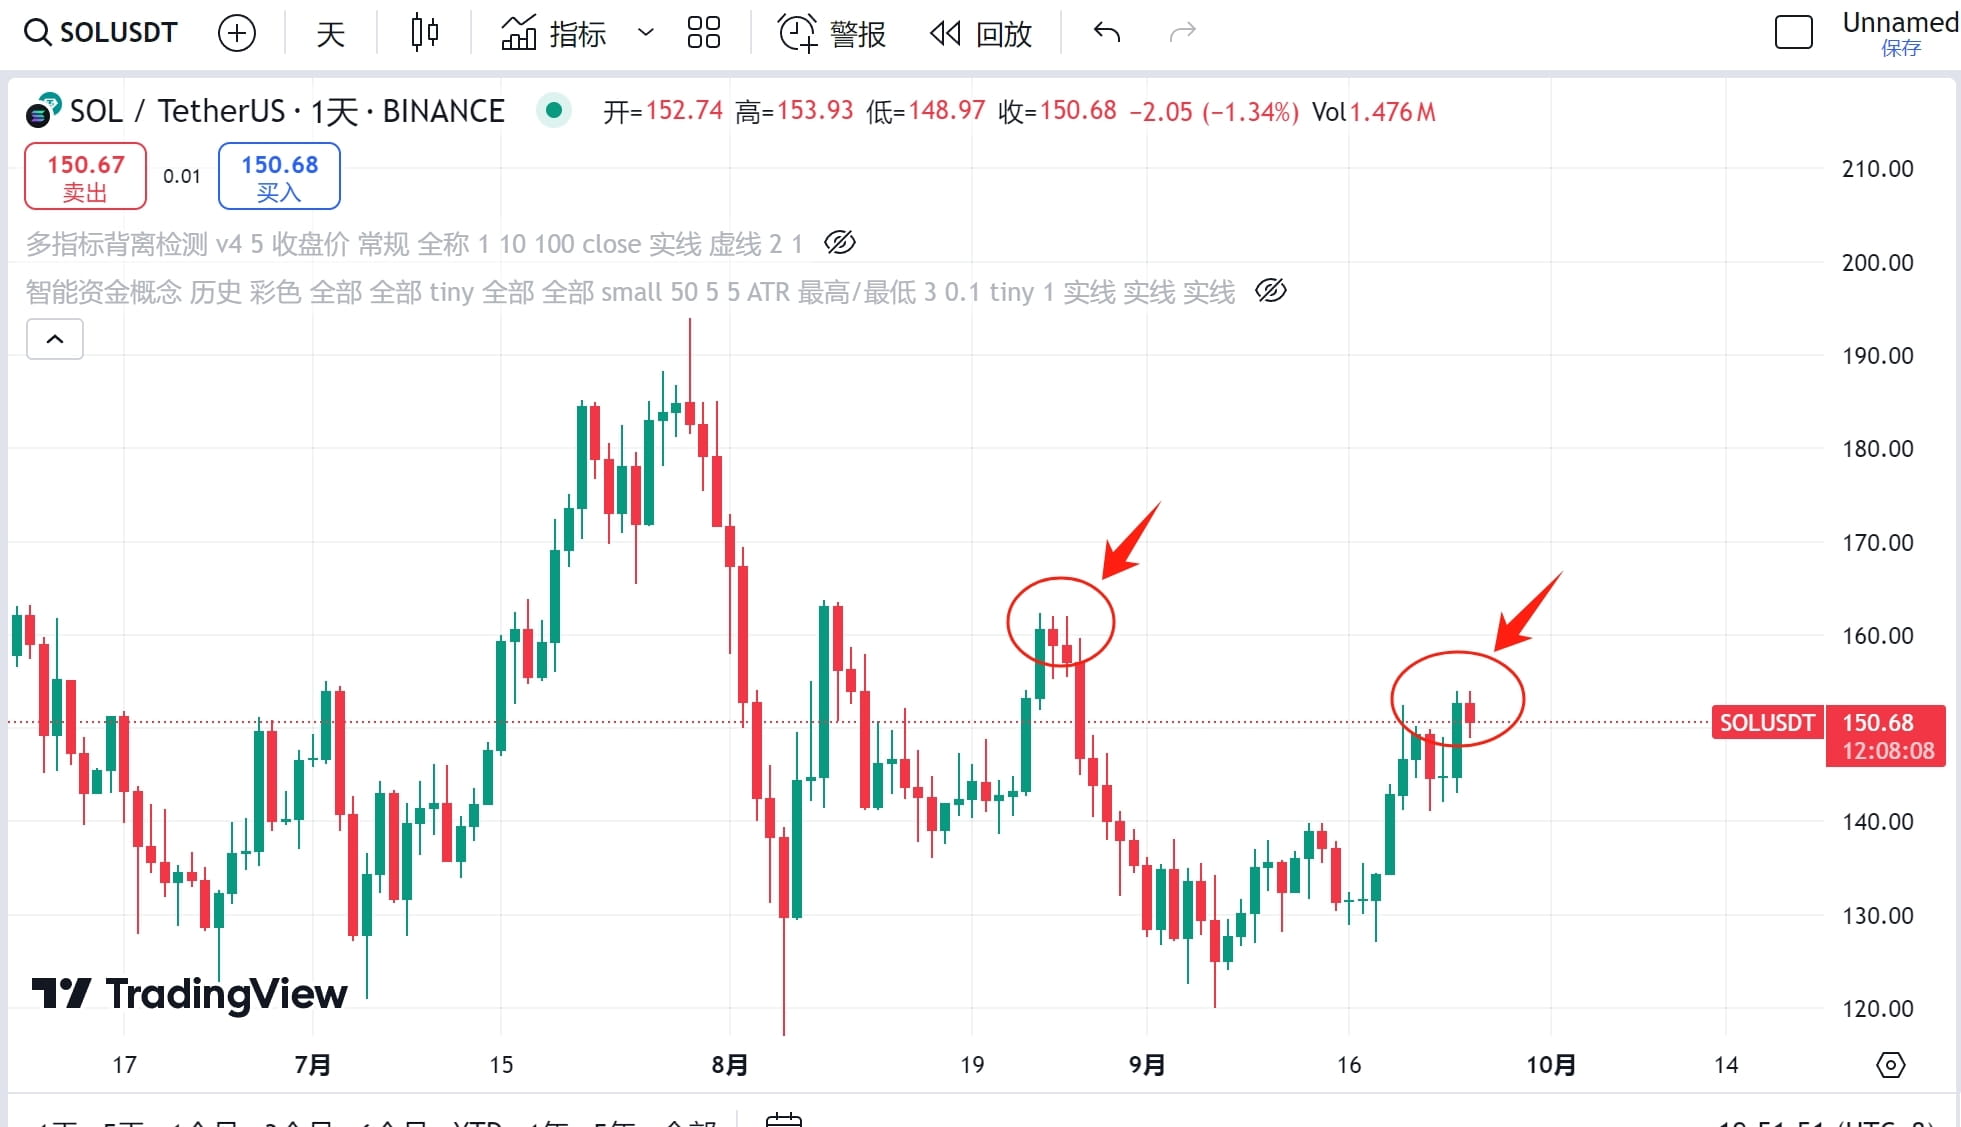
The daily line is not good, and I also want to be like Da V Tianlong. However, under this pattern, Da V Tianlong's point of view cannot be supported. I really can't continue to sing more at this price. I have seen the trend in 2021, and it is not so magical.
Finally, let’s take a look at BNB
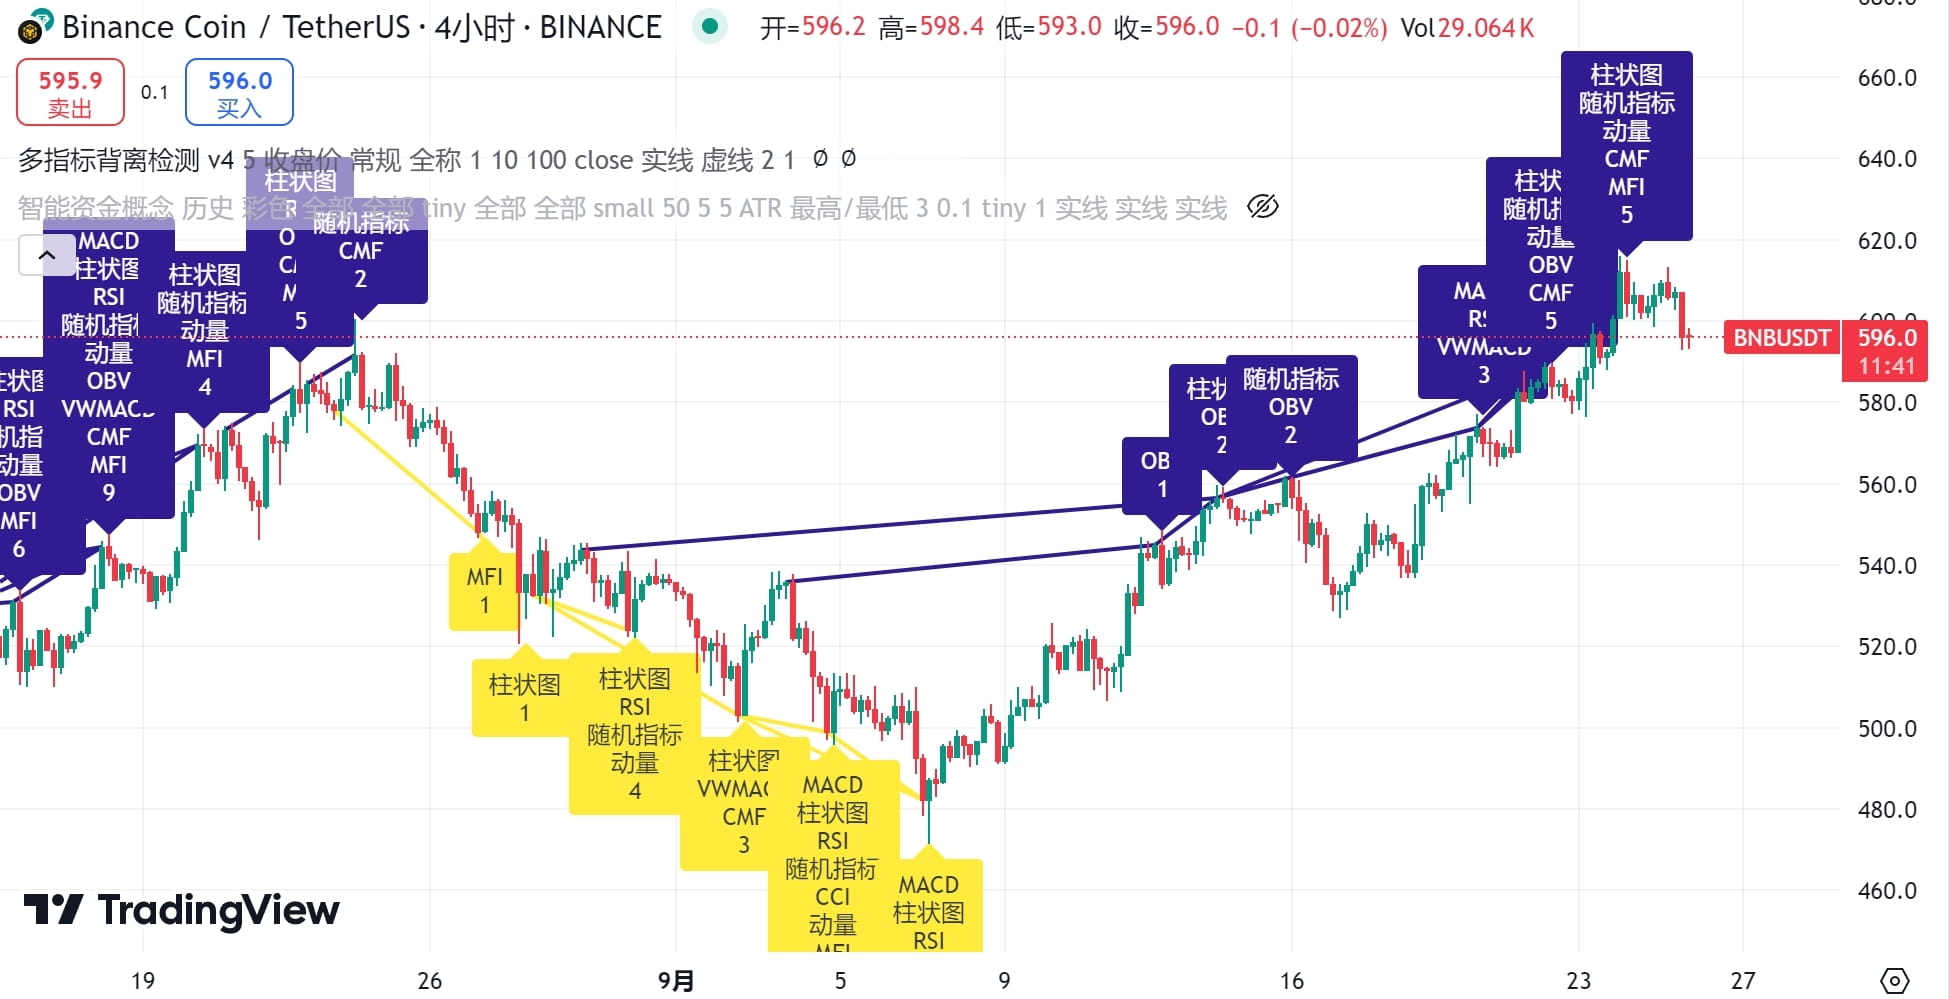
It also diverged several times in a row, and the last divergence occurred at 610. I have been saying for the past two days that friends who have BNB spot can consider locking a 1x short position to avoid risks. Compared with the price of Bitcoin, BNB has definitely risen sharply. Last time when it was 650, BNB also went to 596. If you locked a short position at that time, you can avoid the loss in the subsequent retracement of 470. Don't lock a short position halfway up the mountain to avoid intraday fluctuations. It is meaningless. Just lock it at a relatively high point when a market is about to end. It doesn't need to be absolutely accurate and absolutely locked to the top of the mountain.
Then look at the situation of smc
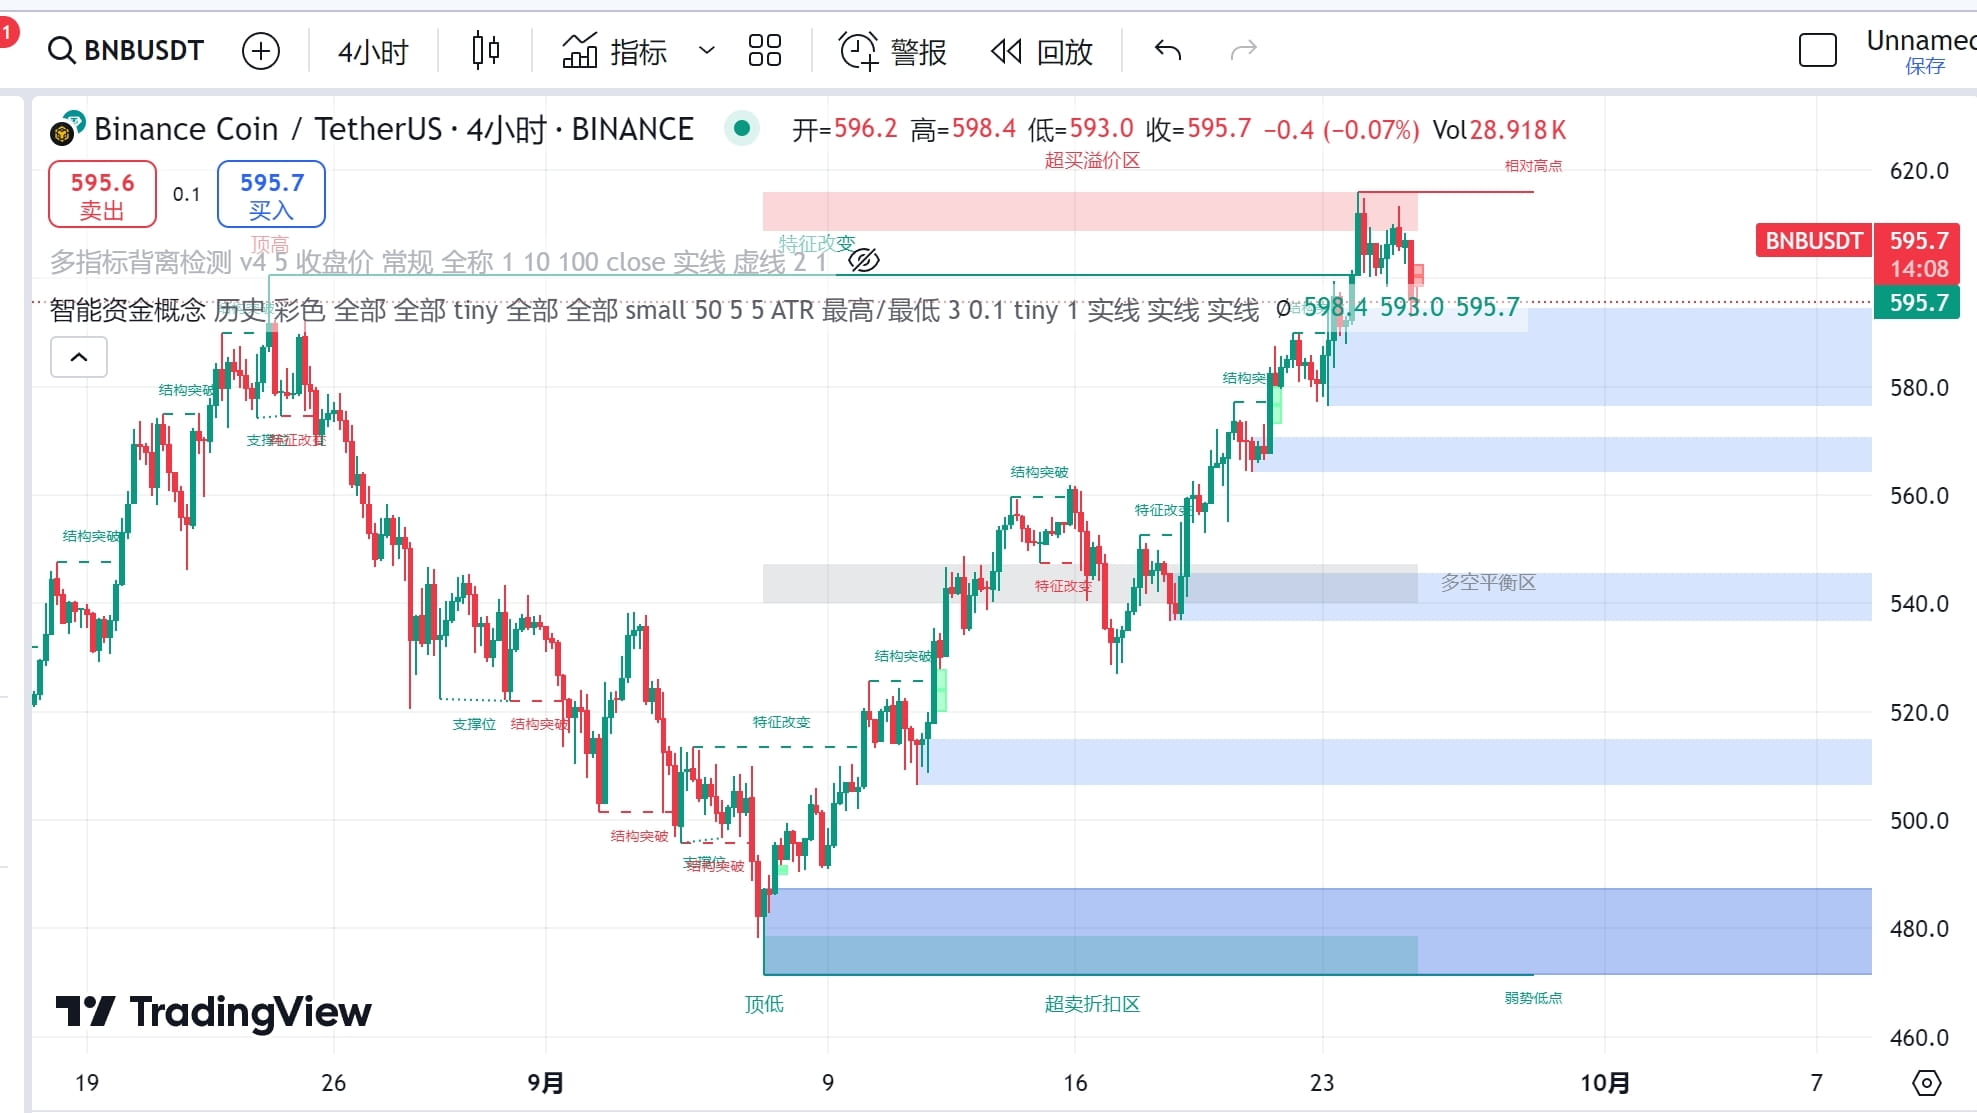
Well, you can notice that the overbought and relatively high points are indicated above. There is a buy order acceptance area at 595. I hope that this group of people will not "backstab BNB" after a period of time, such as abusing the gold shovel as a "dung shovel" and so on. In fact, how to say it, no one asked them to hold BNB for a long time at 595. Those who choose should be responsible for their own choices. It's okay for you to buy. Before buying, consider how long you want to hold it. If you want to hold it for a long time, try to wait patiently until the price reaches the oversold discount area or near the previous low, and then enter the market. A suitable chip price can effectively enhance your confidence in holding positions.
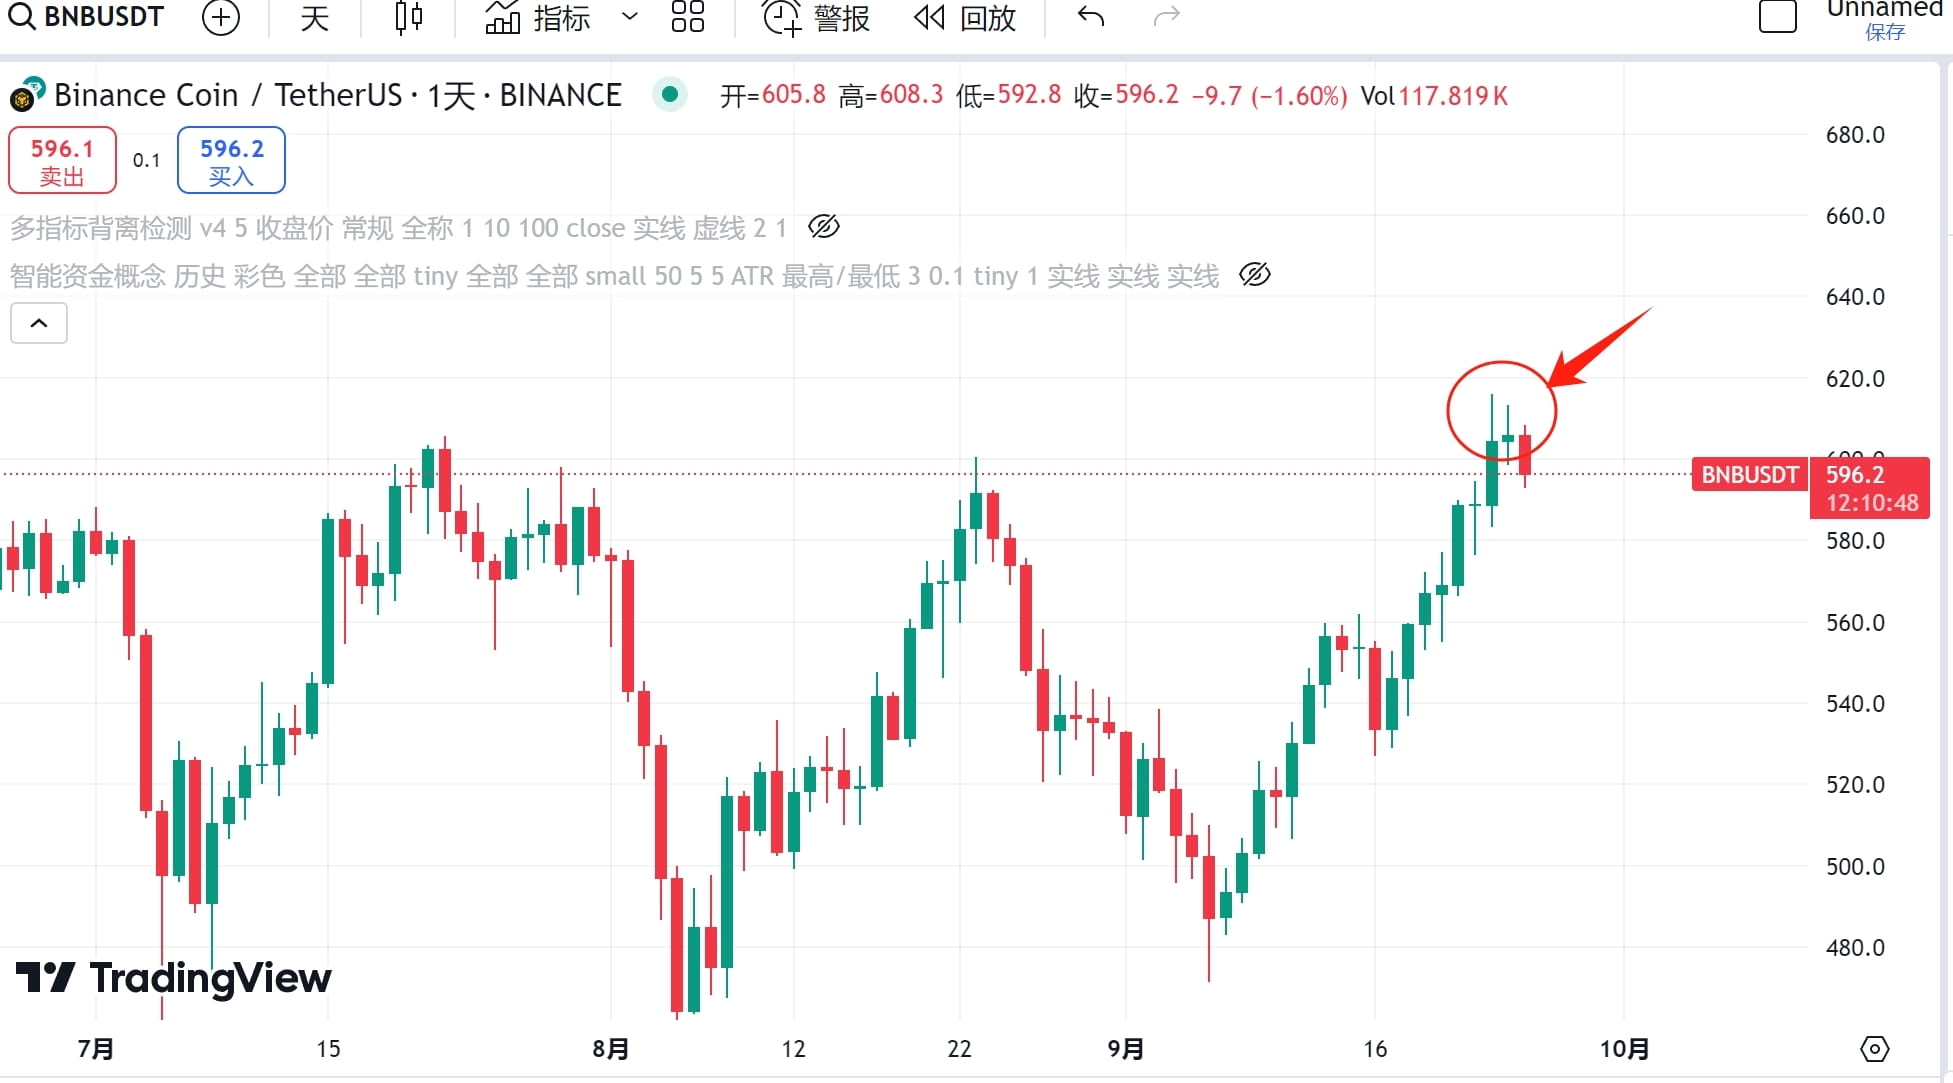
I still say that the W is complete. If you think you can spiral upwards from the top of the W, I agree. As long as you are happy, everyone shares their own views. There is really no need to conflict or attack each other. There is no point.
Written at the end:
Any indicator is used for assistance and reference. It can make up for your misjudgment due to insufficient learning to a certain extent. However, any indicator has obvious advantages and disadvantages. It is definitely inappropriate to pin all your hopes on the indicator. If you want to take root in this industry for a long time, you must maintain sufficient learning ability.
How do you get a sense of the market? This is learned from a large number of replays. Watching the market does not mean you have to keep looking at the K-line, but you have to keep looking at the traces before major market conditions occur and before the trend reverses. If you look at it more, you will also have the so-called "sense of the market" that is hard to explain. No market can turn 180 degrees on the spot. If there is a change, there must be signs and traces in advance.
Finally, none of these Chinese translations and modified indicators are charged, they are all shared for free. Almost everyone in the group has a copy, so please stop spreading rumors that I am doing a "paid private domain", there is no such thing.
Finally, I am just a leek, don't have too high expectations of me, I just hope that through some methods and efforts, I can help novices better get through the novice period, lose less money, and establish the correct trading logic and methods as soon as possible. If some of the content has misled you, I would like to say sorry to you.
Accept all criticisms and all different opinions. I also hope that you can put forward your views, and we can discuss and study together and make progress together. Standing still is the beginning of destruction. But I hope that your views can be supported by some arguments. It is better not to say "I feel, I think, my experience is so and so". That is a wish for the price and market. Maybe you can make a wish successfully once, but you won't make a wish successfully every time. My friend, when the wish fails, should it end with a liquidation?
Why do I see short and long positions regardless of the trend? This is to take care of those who trade intraday, not to make you go against the general trend and get stuck or stop loss. I will revise the article later and add obvious tips for short selling in a multi-trend or short buying in a downtrend. There were tips before, but for some reason, many friends never read them.
Finally, I hope I have not misled you in any way. If I have, I am deeply sorry for that.


