K-line trend:
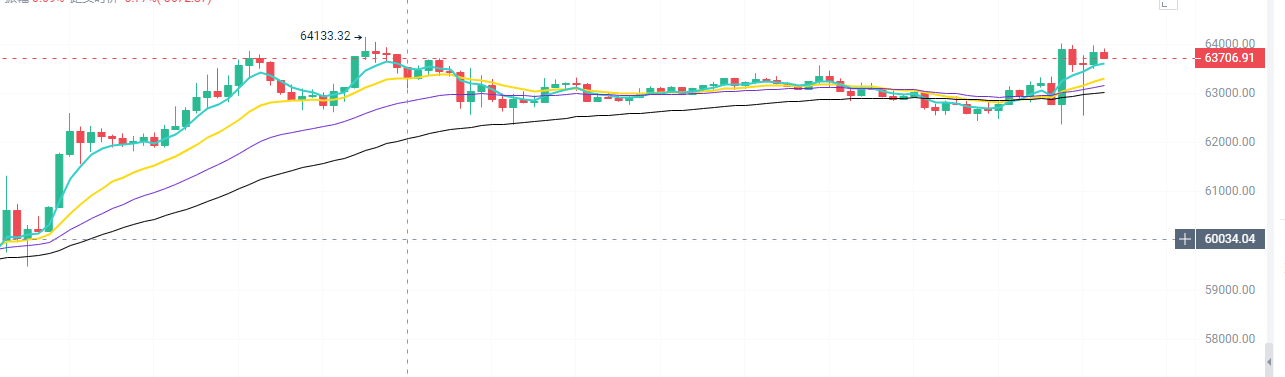
BTC has been moving quite steadily recently, with the price fluctuating between 62500 and 64000. There are many lower shadows, and it seems that the price can hold up.
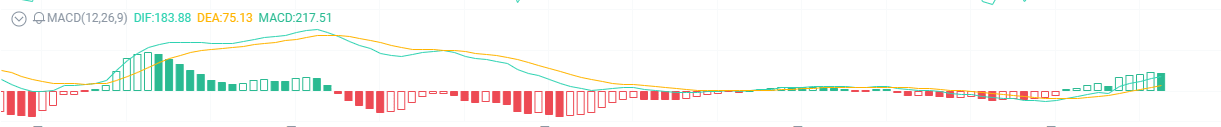
Technical indicators:
MACD: The MACD column turned from green to red, and the DIF line also crossed the DEA line. It seems that the bulls are about to exert their strength.
RSI: The RSI value is hovering around 60. It has not yet reached the overbought zone, but it is not far away. We need to pay attention to whether there will be a pullback.
EMA: The short-term EMA (7) is ahead of the medium-term EMA (30), while the long-term EMA (120) is further behind. The moving averages are all aligned, indicating a bullish trend.
Volume:
The trading volume has been large in recent hours, especially at 6 and 8 am on the 23rd, the market was much more lively.
The price goes up as the volume increases, and there are obvious signs of money coming in.
BTC one-hour trend forecast: bullish
【Buy and sell point recommendation】
Buying opportunity 1: 63000 USDT (near the previous low point, with support at the integer level)
Buying opportunity 2: 62000 USDT (EMA120 moving average, historical low)
Stop loss for long: 61500 USDT (500 points below the second buy point, to prevent false breakouts)
Selling opportunity 1: 64500 USDT (near the recent high point, with high pressure on the integer position)
Selling opportunity 2: 65500 USDT (above the previous high, there is still room for growth)
Stop loss for short selling: 66,000 USDT (500 points above the second selling point, to prevent false breakthroughs)
The above is Mr. A’s personal opinion, which is real-time and for reference only#BTC走势分析


