23/07/22BTC breaks through 68,000, long and short double explosion, ETH spot ETF is about to be launched, Biden announces withdrawal from presidential election

Last night we reminded that BTC hourly triangle broke through and reached a high of 67,700, then plunged downward to a low of 65,777, and then quickly rose to break through 58,000, with both long and short contracts exploding. Fortunately, we are spot and have risen by nearly 4,000 points since we reminded of the triangle breakthrough on the evening of the 19th. Congratulations to those who understood and followed suit.
We never make subjective judgments on the market. We always make decisions based on the signals on the market. The words of Mr. Bao in "Flowering Flowers" are very classic. The market is always right, and only you are wrong. If you rush in too fast and escape too slowly, you will definitely suffer a setback. Your head is on your shoulders and your feet are on your body. As long as you protect yourself, opportunities will always be greater than risks.
On July 22, US President Biden published an open letter announcing that he would not seek re-election. Biden said that although he had intended to seek re-election, he believed that in the best interests of the party and the country, he would step down and focus on fulfilling his presidential duties for the rest of his term, and said that he would give a speech later this week to elaborate on this decision.
Flatbread
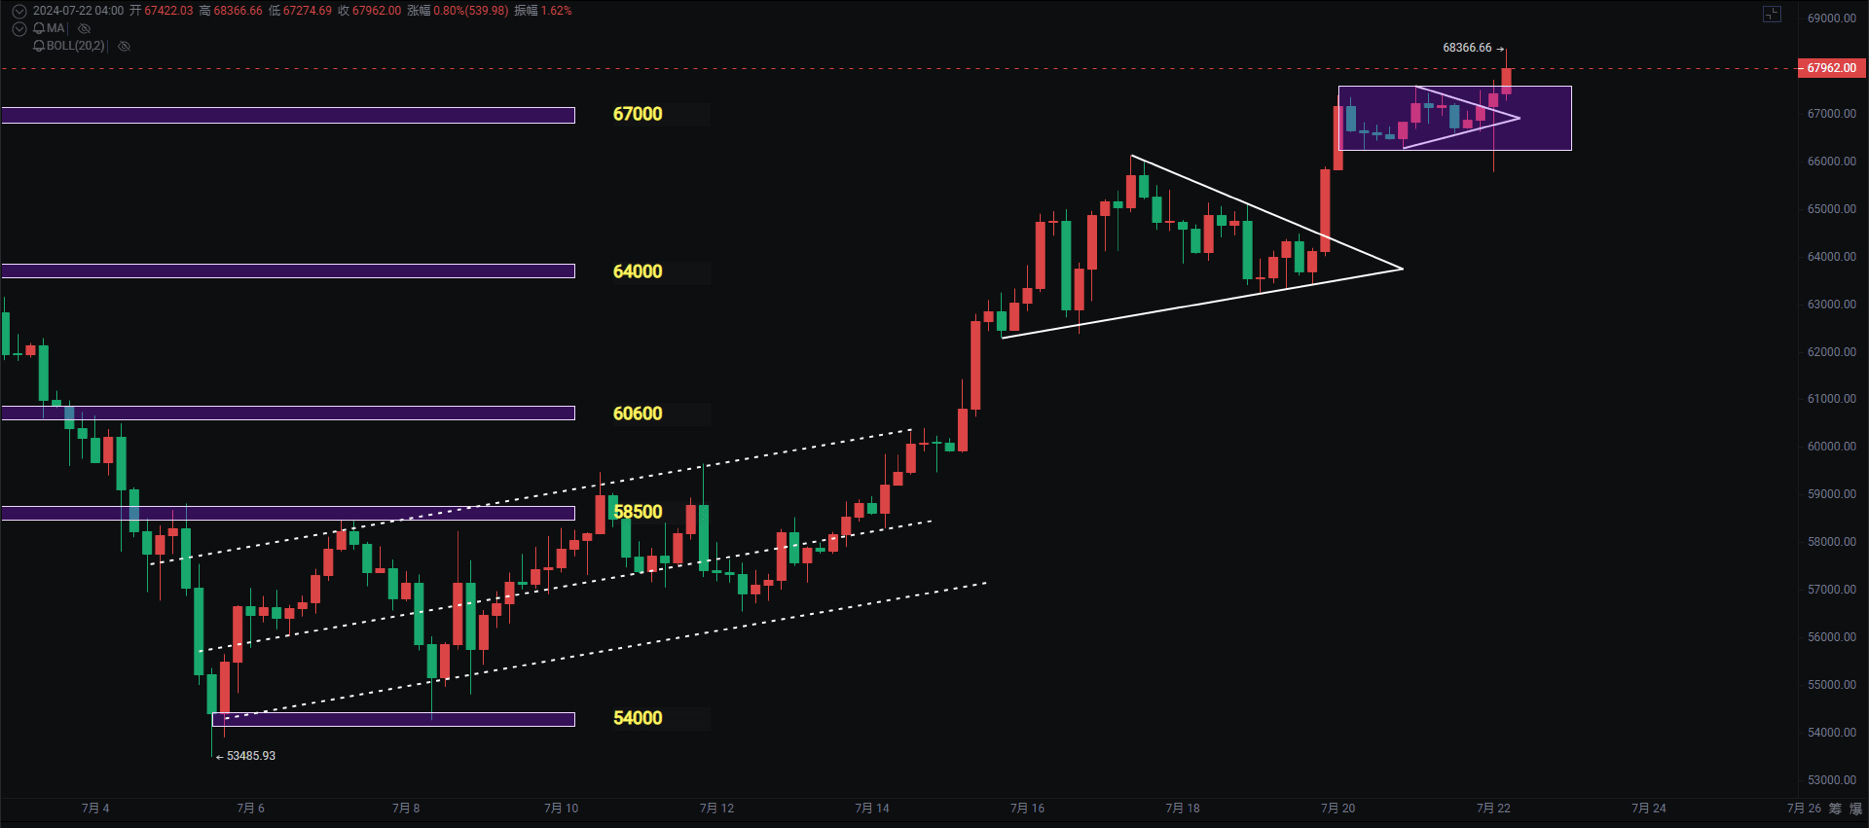
The weekly line broke through the BOLL middle track and the new week opened and fell back to the middle track near 65500. For the time being, it is still the view of last night. The weekly KDJ crosses ❌, and the MACD column shortens. If the fast and slow lines can cross above the water, a bigger market is worth looking forward to. The OBV indicator crosses the yellow line and then flattens. The weekly line is still bullish if it does not fall below 65500.
Daily Line
The power of this wave of bottom divergence on the daily line has continued to pull nearly 15,000 points, which is rare, but we can only follow it. It was also said before that it is still subject to the pressure of the double-yin and yang on June 11-13, and the market fluctuates upward. The OBV indicator breaks through the yellow line, and the RSI overbought area support continues to move upward. The 4-hour breakout of the triangle structure support 67,600 in the box.
support:
pressure:
ether
The weekly line also broke through the middle track and stepped back to support. The weekly line is still considered as a box oscillation. The technical indicators are not as good as the big cake. It depends on the impact of the upcoming ETF or the rebound. The daily line has been oscillating in a narrow range of 3300-3500. Although the bottom has risen, be patient and hold it first, wait for the ETH boot to land, and then look at the inflow of ETH spot ETF and the selling of Mt. Gox and Grayscale ETHW.
support:
pressure: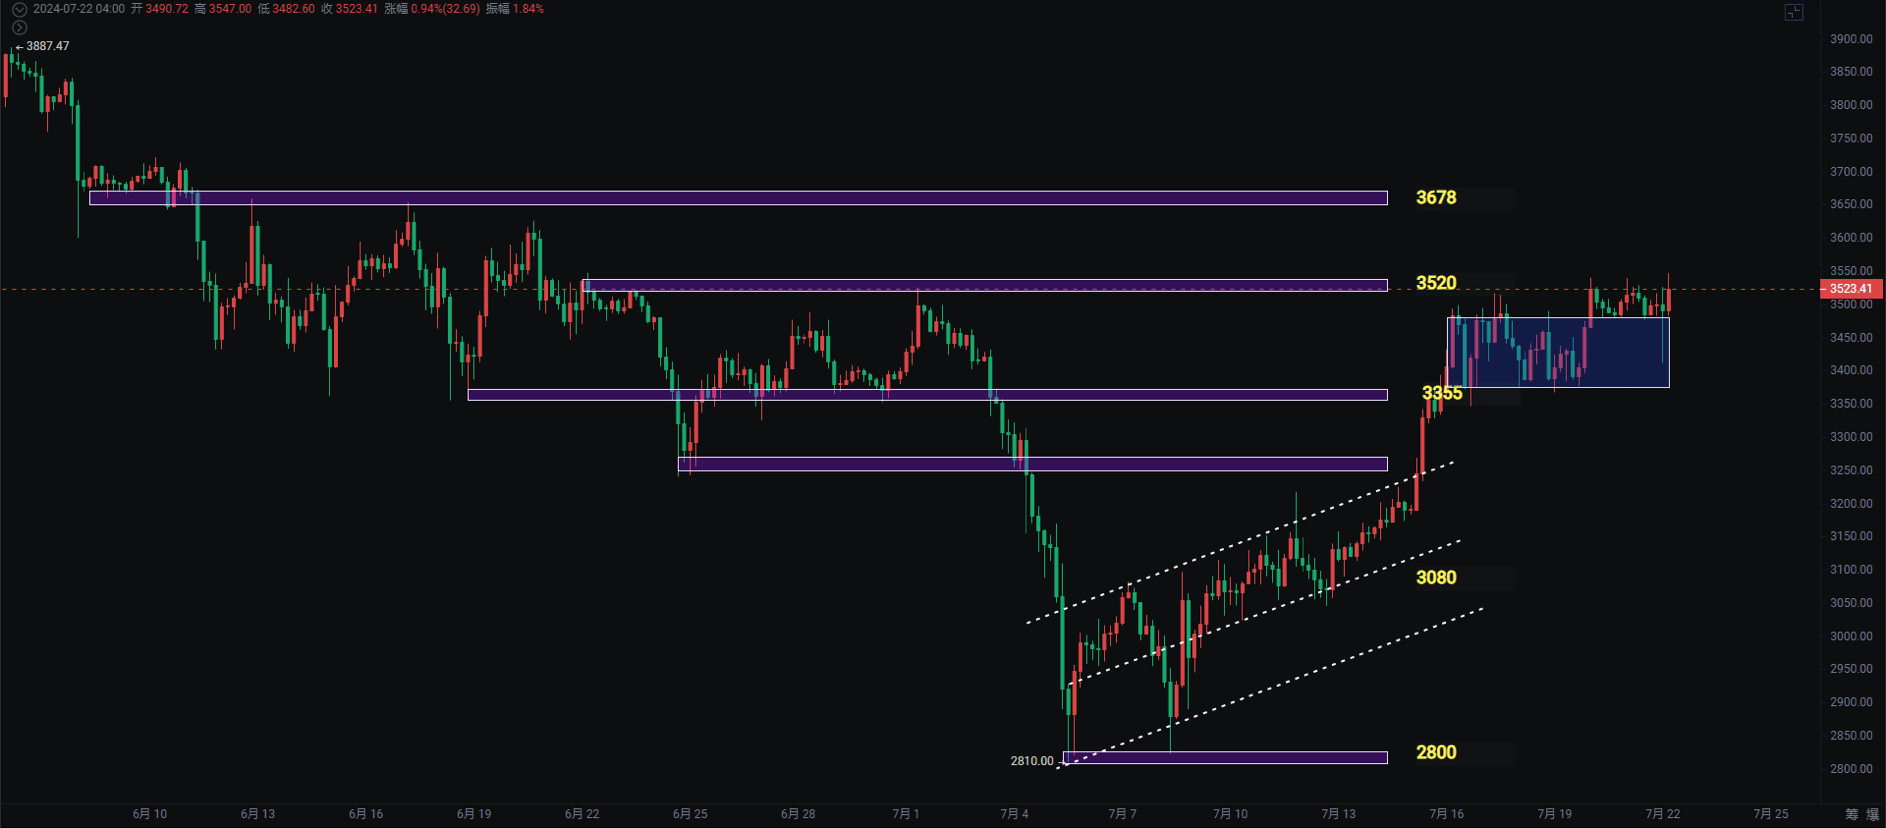
$BTC $ETH $SOL #以太坊ETF批准预期 #币安HODLer空投BANANA #美国大选如何影响加密产业? #WazirX黑客事件


