Bitcoin to US Dollar
(BTCUSD)
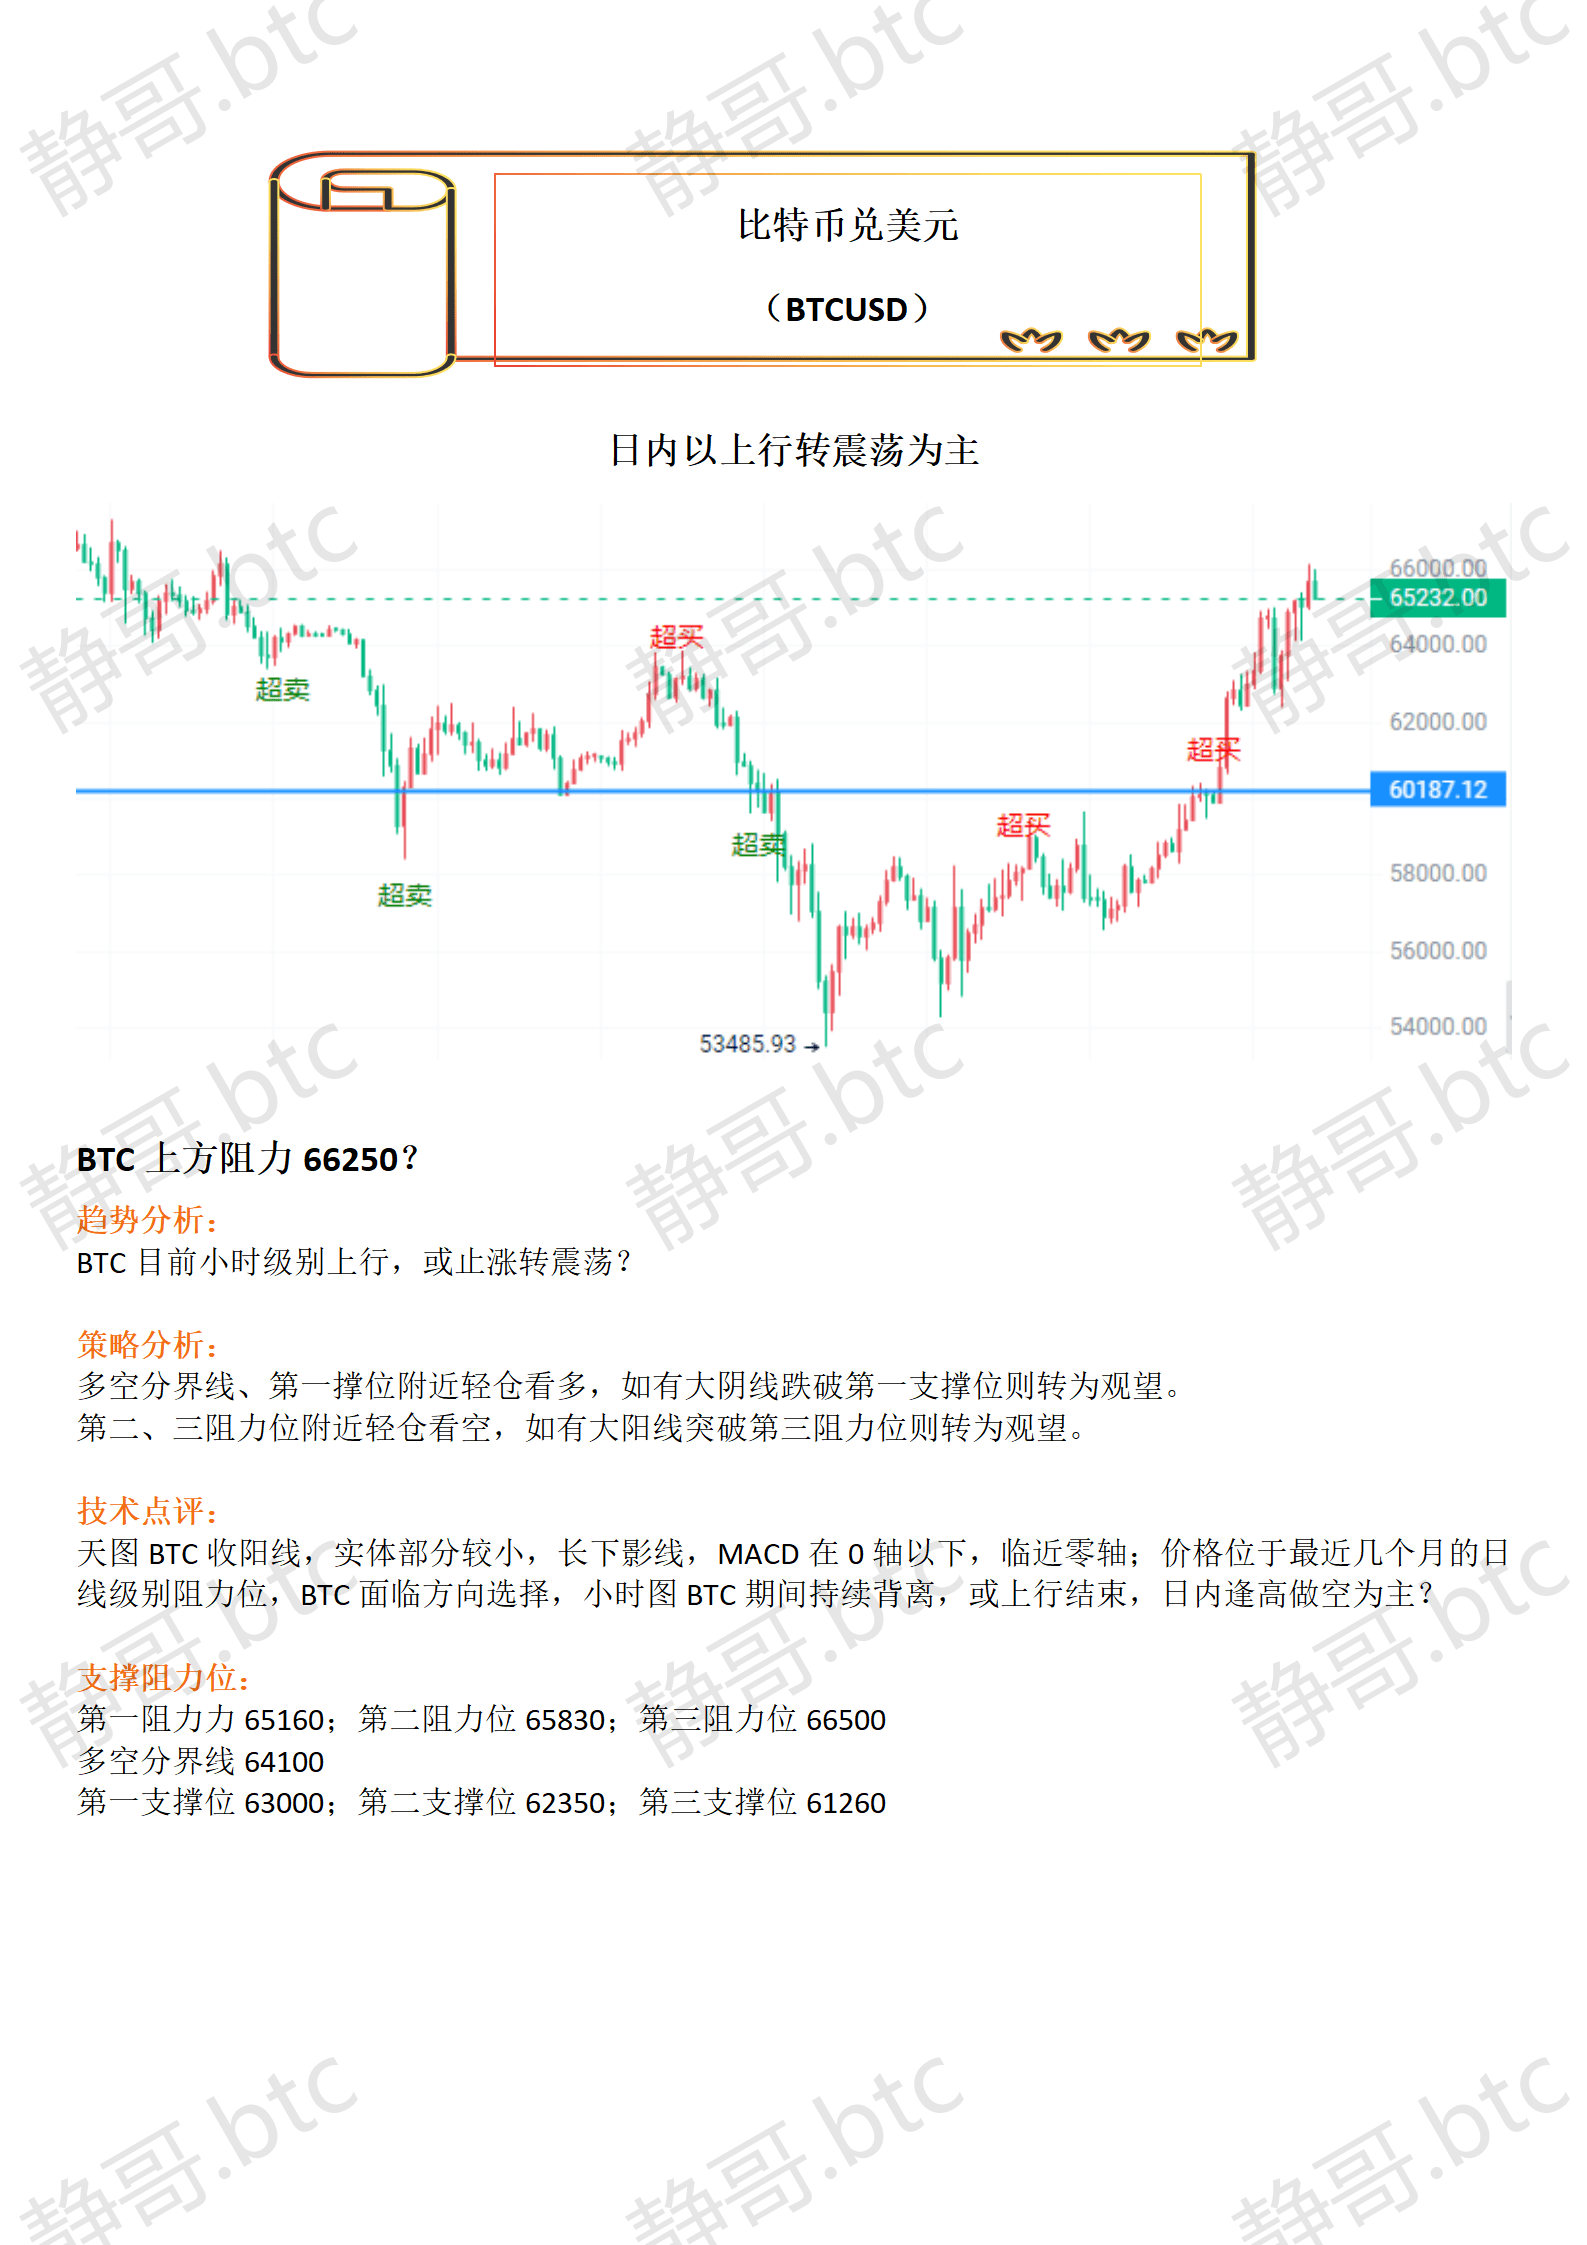
The day is mainly upward and then volatile
BTC upper resistance 66250?
trend analysis:
BTC is currently moving upward at the hourly level, but will it stop rising and turn to volatility?
Strategic Analysis:
Go bullish with a light position near the bull-short dividing line and the first support level. If a large negative line falls below the first support level, turn to wait and see.
Keep a light position and be bearish near the second and third resistance levels. If a large positive line breaks through the third resistance level, switch to wait and see.
Technical review:
On the daily chart, BTC closed with a positive line, with a small real body and a long lower shadow. MACD is below the 0 axis and close to the zero axis. The price is at the daily resistance level in recent months. BTC faces a direction choice. On the hourly chart, BTC continues to diverge, and the upward trend may end. Is shorting mainly done on rallies during the day?
Support and resistance levels:
The first resistance is 65160; the second resistance is 65830; the third resistance is 66500
Long and short dividing line 64100
The first support level is 63000; the second support level is 62350; the third support level is 61260
Ethereum to US Dollar
(ETHUSD)
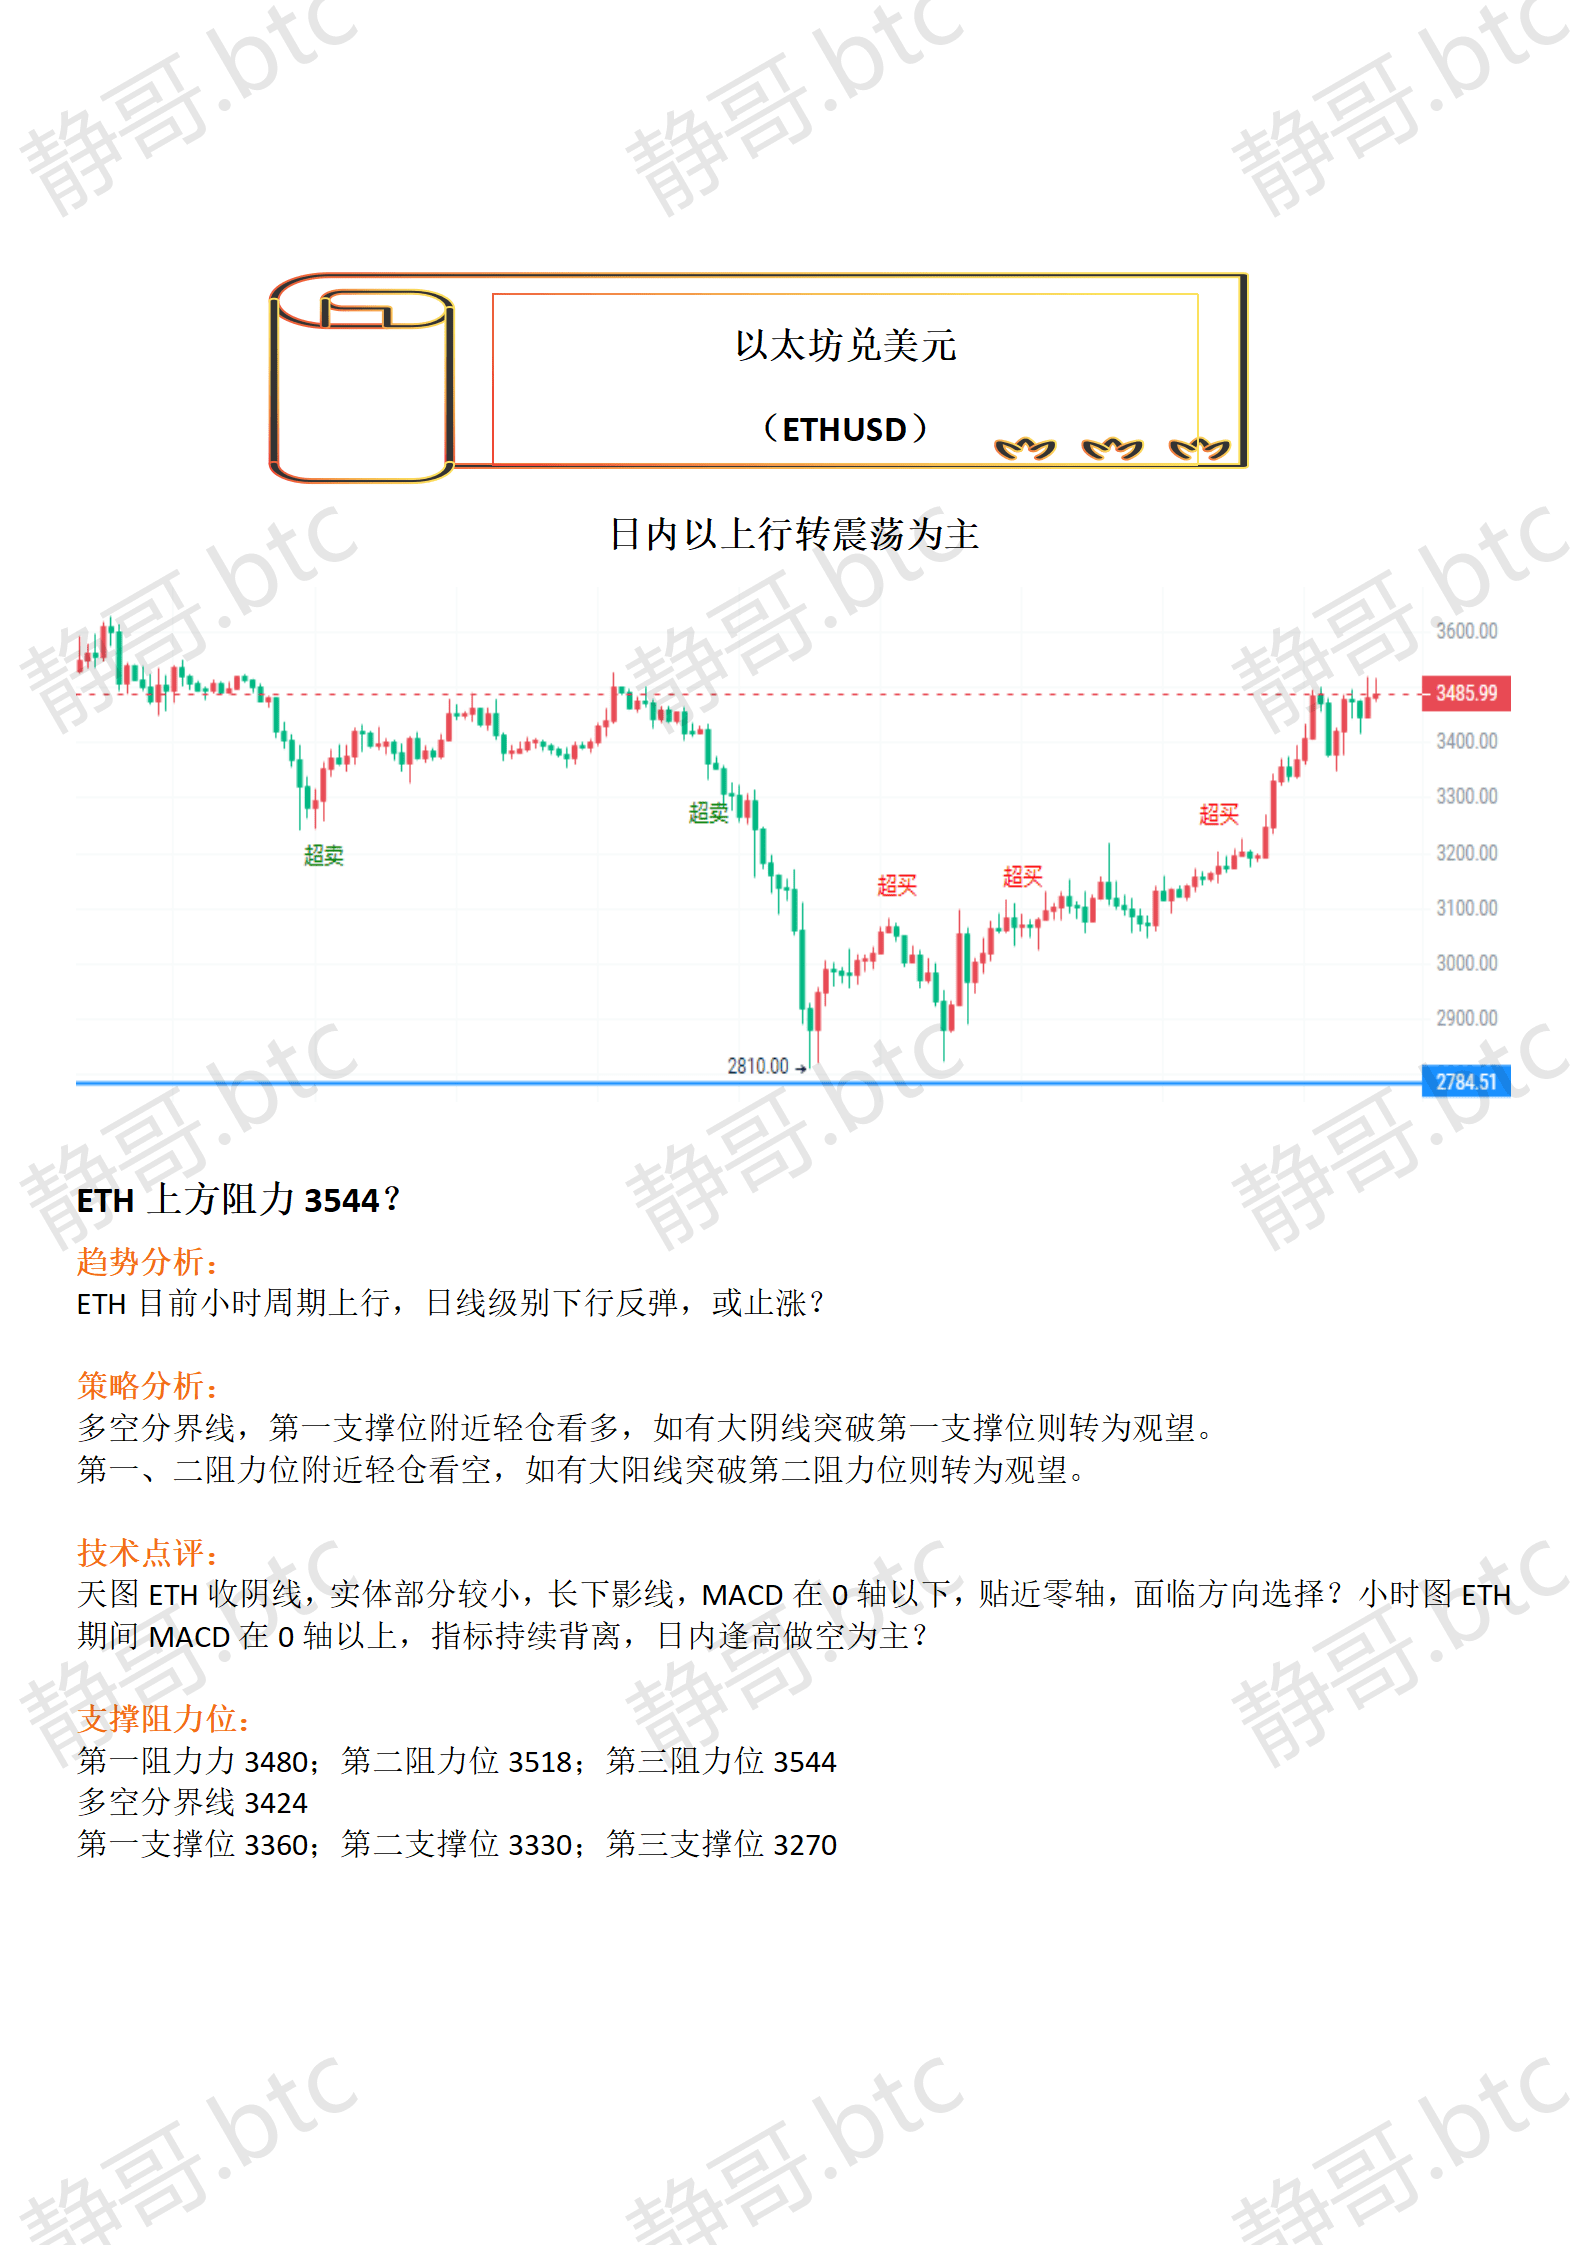
The trend turns from upward to volatile during the day
ETH upper resistance 3544?
trend analysis:
ETH is currently moving upward on the hourly cycle and rebounding downward on the daily level, or is it stopping rising?
Strategic Analysis:
The long-short dividing line, go long with a light position near the first support level. If a large negative line breaks through the first support level, turn to wait and see.
Take a bearish stance with a light position near the first and second resistance levels. If a large positive line breaks through the second resistance level, switch to wait-and-see.
Technical review:
ETH closed with a negative line on the daily chart, with a small real body and a long lower shadow. MACD is below the 0 axis and close to the zero axis. Is it facing a direction choice? ETH's MACD during the hourly chart is above the 0 axis, and the indicators continue to diverge. Is it mainly shorting at intraday highs?
Support and resistance levels:
The first resistance is 3480; the second resistance is 3518; the third resistance is 3544
Long and short dividing line 3424
The first support level is 3360; the second support level is 3330; the third support level is 3270