
Identifying and Trading Harmonic Butterfly Patterns
Disclaimer: Digital asset prices can be volatile. Do your own research. See full terms here and our risk warning here. Binance Futures products are restricted in certain countries and to certain users. This communication is not intended for users/countries to which restrictions apply.
Main Takeaways
In technical analysis, the harmonic butterfly is a popular reversal chart that consists of four price swings.
Fibonacci retracement levels can support the identification of harmonic butterfly chart patterns.
The confirmation of the harmonic butterfly pattern comes from the establishment of five specific price points that may precede a market breakout.
Technical analysis is a popular tool used by traders to analyze the market and identify potential price movements. Traders use various trading patterns and signals to read the rising and falling markets. One of the technical analysis patterns traders use is the harmonic butterfly pattern. The goal of the harmonic butterfly pattern is to identify turning points in the market through a five-point reversal chart pattern.
This article explains what the harmonic butterfly pattern is, how to trade it, how to accurately identify it, and a few other key takeaways when trading the pattern.
What Is the Harmonic Butterfly Pattern?
The harmonic butterfly pattern is a retracement pattern that traders use to identify a potential trend reversal. The pattern consists of five points, commonly known as X, A, B, C, and D. The technical pattern also comprises four waves when the points are connected, labeled XA, AB, BC, and CD.
The harmonic butterfly pattern formation resembles the wings of a butterfly and can appear either in an uptrend or a downtrend. While the pattern follows the general shape of a butterfly, identifying the chart pattern more accurately requires the Fibonacci sequence, which creates ratios of 0.618 and 1.618.
Identifying a Harmonic Butterfly Pattern
Once there is a formation of a pattern that resembles a harmonic butterfly pattern, trend lines can be drawn to facilitate the chart analysis and pattern visualization.
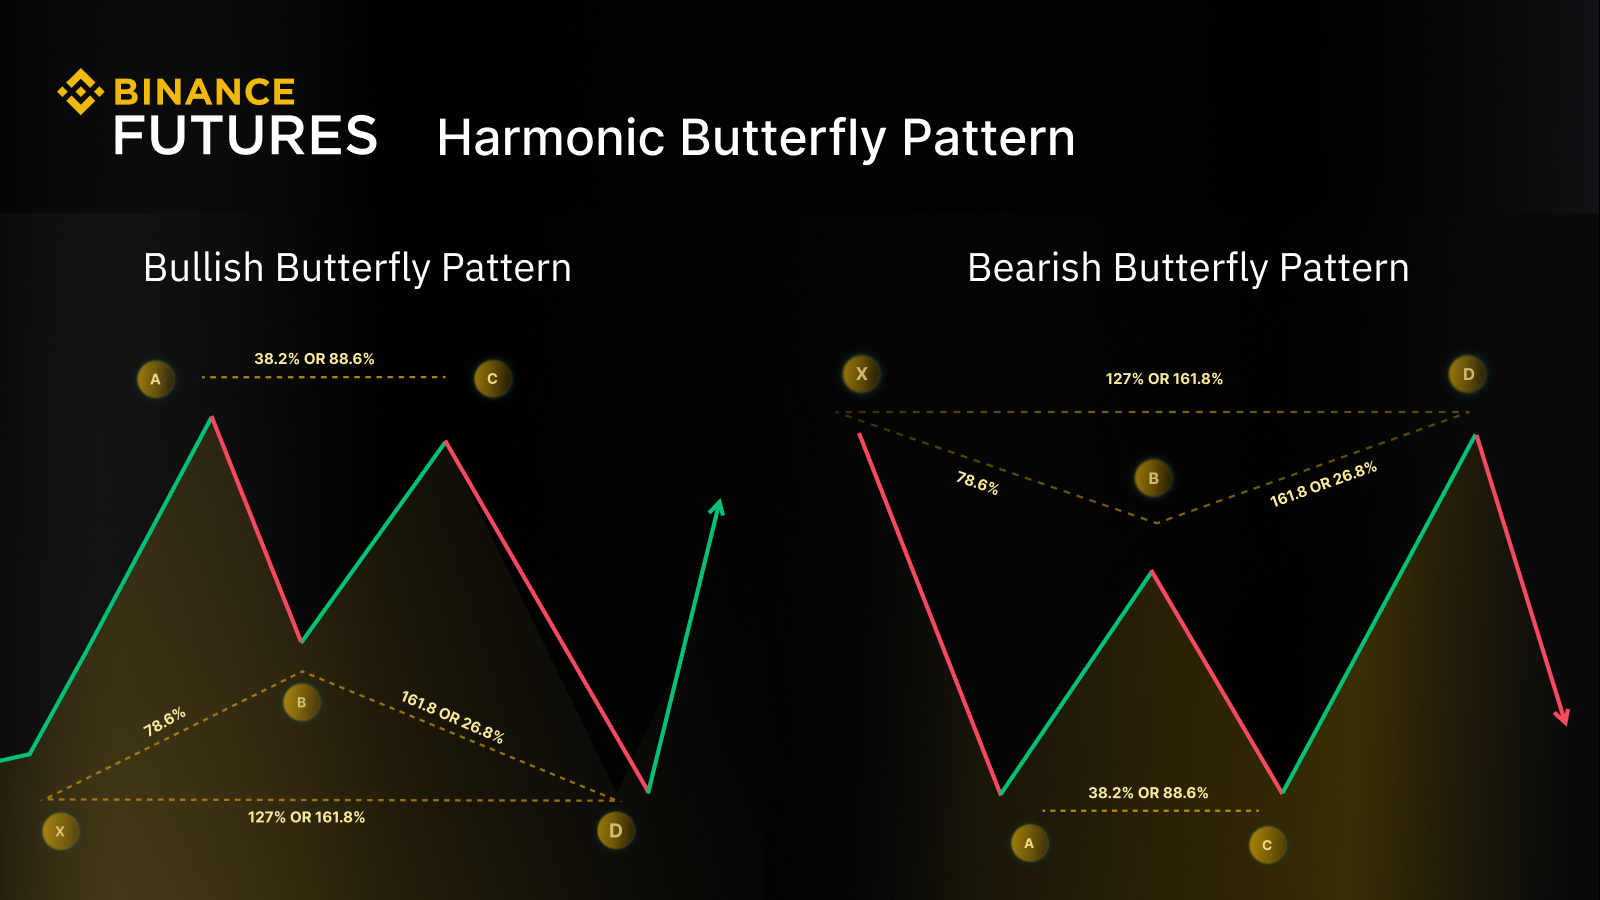
For example, in a bullish harmonic butterfly pattern, the asset price touches five different points, creating a four-wave pattern that looks like the letter M:
The price moves upward from point X to A (XA wave).
Then it retraces from point A to B (AB wave).
Next, we have an uptrend from point B to C (BC wave). However, point C is slightly lower than point A.
Finally, another downtrend from C to D (CD wave).
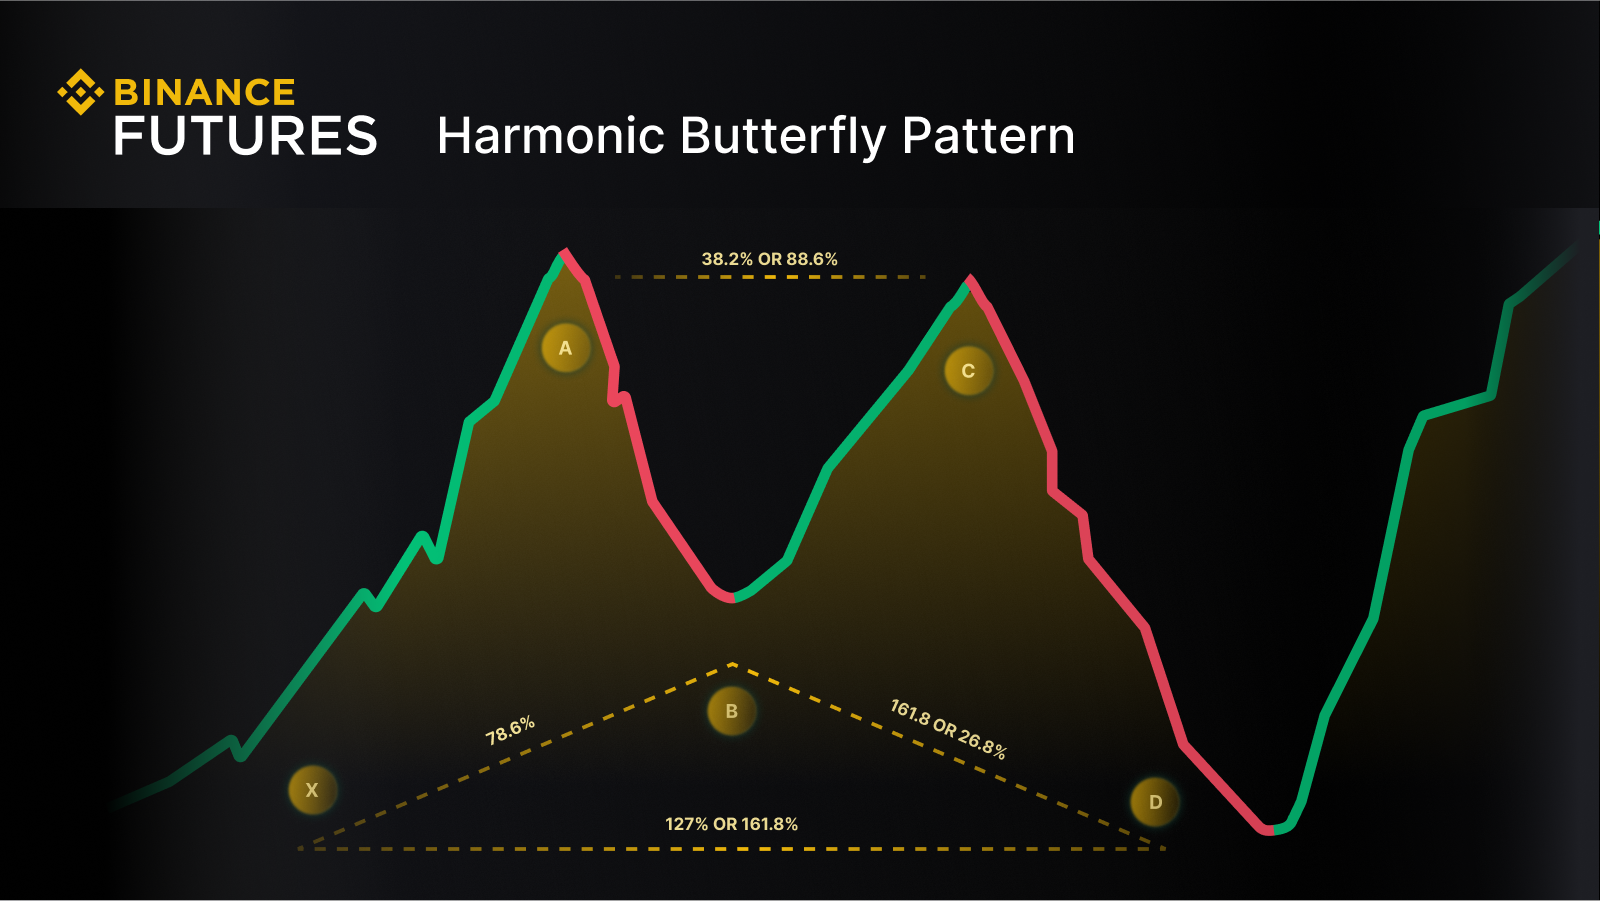
Additionally, point C usually rebounds to Fibonacci levels of either 38.2% or 88.6% relative to the AB leg. The harmonic butterfly pattern is then formed when the upward move to point C corrects to point D, which is below point X. Point D becomes the new swing low and could be measured ahead of time to be an extension of the length of XA by a factor of 1.27. Once there is a reversal from point D, with increased buying volume, then the pattern is complete, suggesting a potential market rally.
Please note that the Fibonacci retracement level acts as a target range – and that prices may not reach the exact price levels.
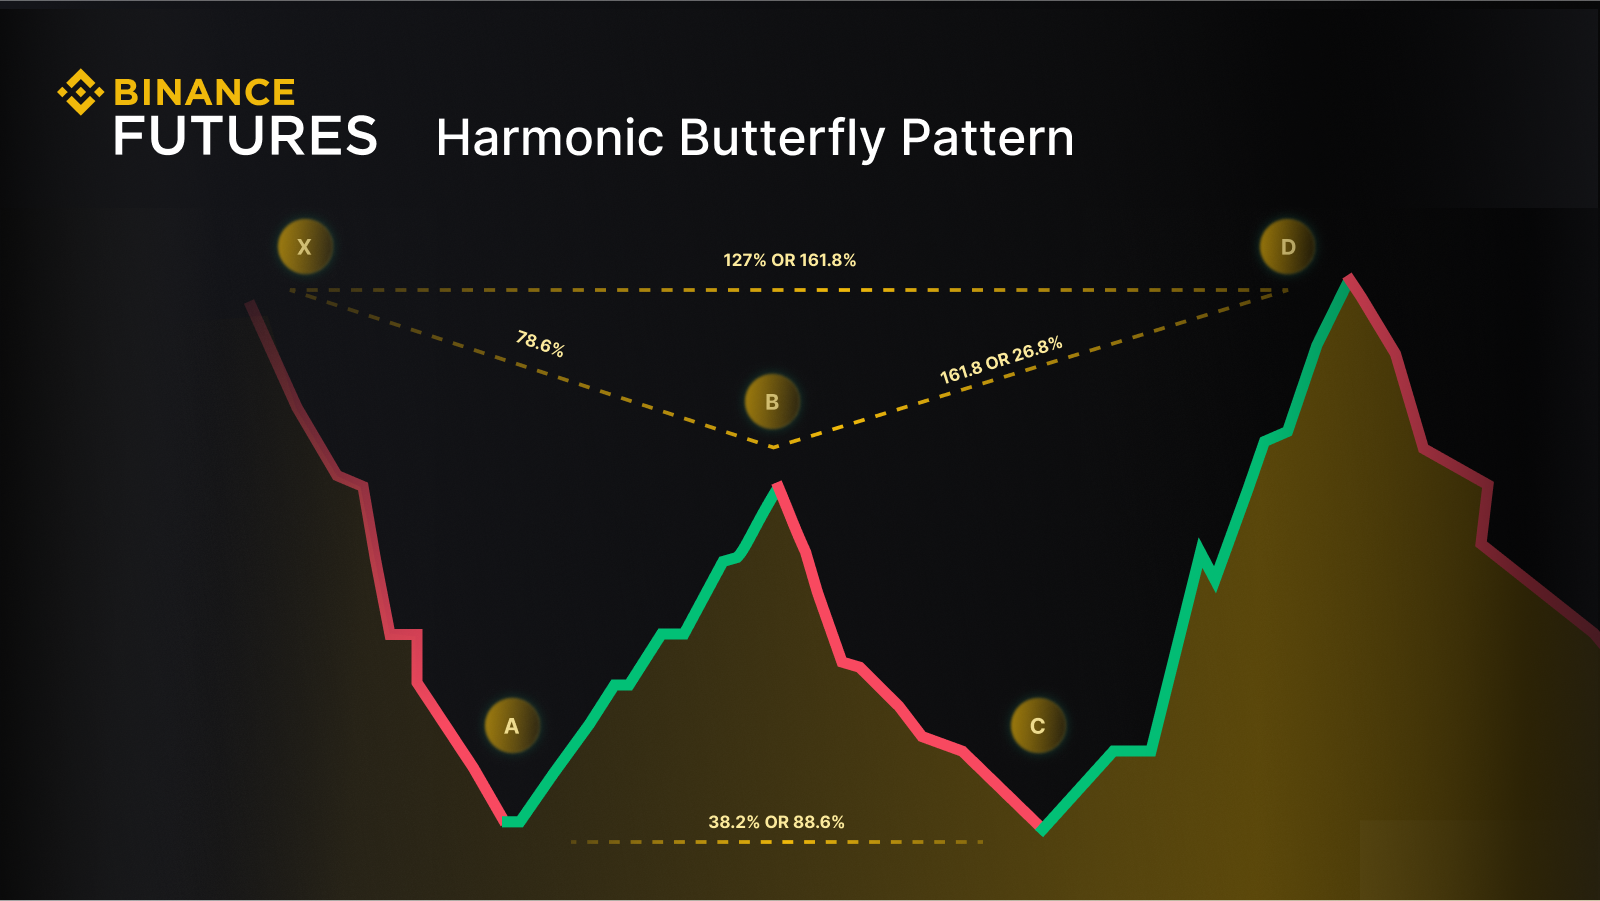
Conversely, a bearish harmonic butterfly pattern would look like the letter W.
The four-wave starts at point X and corrects to point A, forming the XA wave.
Then, the price moves up from point A to B (AB wave), which is usually a 78.6% retracement of the XA wave correction.
Point B to point C will be another retracement, but since it is the second correction, it will not be as strong as the first downtrend (XA).
Finally, the CD wave will consist of another upward move, and point D can be typically measured to be an extension of the length of XA by a factor of 1.27.
Trading the Harmonic Butterfly Pattern
1. Identify the pattern
First, identify the harmonic butterfly pattern in the cryptocurrency market by looking for the five points: X, A, B, C, and D. This would determine whether the pattern is bullish or bearish.
2. Define your entry point
For the bullish harmonic butterfly pattern, traders may choose to trade a breakout by placing an order after a reversal, i.e., when the price breaks above point D. For the bearish pattern, it would be the opposite, when the price breaks below point D.
3. Define your stop loss
Traders may choose to place a stop loss order below point X to limit their losses in case the pattern fails.
4. Define your exit
Traders often set a take-profit order somewhere around point A or point B. This is where the price is likely to encounter resistance.
How to accurately define the harmonic butterfly pattern?
To accurately define the harmonic butterfly pattern, it is necessary to ensure that the five points (X, A, B, C, and D) meet the criteria mentioned above. Traders also need to take into account the Fibonacci ratios which provide an overall guideline to the formation of the harmonic butterfly pattern. The aforementioned pattern can be used in conjunction with other technical analysis tools such as trading volume to confirm a potential breakout or reversal. Traders might want to take into account the market trend and various market factors prior to trading the pattern.
Closing Thoughts
Trading the harmonic butterfly pattern comes with risks, just like any other trading strategy and technical analysis pattern. It is important for traders to accurately identify the pattern and deploy proper risk management strategies, such as using stop-loss orders. It is important to consider the risks associated with the pattern and be patient when waiting for the pattern to complete.
Each trader should take their financial objectives and risk tolerance into consideration when deciding whether to trade the harmonic butterfly pattern. Conducting an independent assessment to determine if this trading strategy aligns with their personal financial goals and profile can be helpful. It's also beneficial for them to ensure that they understand and accept the risks associated with such a strategy before engaging in trading. This comprehensive evaluation can aid traders in making well-informed decisions about their involvement in the market.
Further Reading
Risk Warning: This content is presented to you on an “as is” basis for general information and educational purposes only, without representation or warranty of any kind. It should not be construed as financial or investment advice, nor is it intended to recommend the purchase of any specific product or service. Digital asset prices can be volatile. The value of your investment may go down or up, and you may not get back the amount invested. You are solely responsible for your investment decisions, and Binance is not liable for any losses you may incur. For more information, see our Terms of Use and Risk Warning.
The products and services referred to herein may be restricted in certain jurisdictions or regions or to certain users in accordance with applicable legal and regulatory requirements. You are responsible for informing yourself about and observing any restrictions and/or requirements imposed with respect to the access to and use of any products and services offered by or available through Binance in each country or region from which they are accessed by you or on your behalf. Binance reserves the right to change, modify or impose additional restrictions with respect to the access to and use of any products and/or services offered from time to time in its sole discretion at any time without notification.