
Binance Futures Monthly Trading Report (January)

In the first edition of our Binance Futures Monthly Trading Report, we aim to highlight key information and data on trading activity across the crypto-futures markets. In this report, we discuss the main themes surrounding the resurgence of cryptocurrency markets. Following that, we analyze the performances of each Binance Futures perpetual contract as well as the overall volume and open interest on its platform. Next, we study two key indicators to interpret the prevailing crypto-market sentiment, and lastly, we assess the risk appetite of traders on our Binance Futures platform.
Market overview - January 2020
Cryptocurrencies displayed a remarkable comeback in January after a bear market throughout Q4FY19. BTC prices rose from its low of $7000 and broke above $8000 in a matter of days. Consequently, its total market cap increased by 32%, from $193 billion to $255 billion. On the other hand, the total altcoin market cap moved from $61 billion to $86 billion, an increase by more than 40%, according to Binance Research.
The bullish momentum across cryptocurrency markets can be attributed to 2 factors:
Block reward halving
Macro uncertainties
Bitcoin’s block reward halving has been the dominant narrative around the cryptocurrency markets in 2020. Historically, cryptocurrencies have benefited positively from the impact of halving. Although historical performances do not indicate the future, the upcoming Bitcoin block reward halving should have an impact on BTC prices.
In an interview, Changpeng Zhao (CZ), CEO of Binance, suggested that the market has not priced in Bitcoin’s upcoming block reward halving, which may provide room for further upside.
As block rewards decrease by half, Bitcoin miners will see their cost of production increase. Therefore, miners will not be willing to sell below the price of production, which will further restrict Bitcoin’s supply should its demand continue to grow.
Historically, cryptocurrency markets have displayed strong bullish momentum around halving events. In its previous halving events, BTC prices continued to rally even after block rewards were decreased by half.
Chart 1 - Historical returns post halving events vs. Number of weeks to price peak

Source: Binance Futures
Chart 1 shows historical returns post halving events. After the first halving, BTC prices rallied more than 9000% from $12.50 to $1,150 in a bull market, which lasted more than a year. On its second halving, BTC prices outperformed as well, with more than 2800% returns. Albeit, with slower momentum as BTC prices took 50% more time to reach its peak.
Since the start of the year, macro uncertainties have continued to drag down traditional financial markets. The uncertainties caused a surge in demand for safe-haven assets, which benefited the prices of bitcoin and the broader crypto market.
Chart 2 - Close relationship between BTC and Gold prices

Source: Binance Futures
Amid geopolitical tensions between the U.S and Iran, traditional safe-haven assets like gold, bonds, and the Japanese Yen displayed strong demand as investors seek protection from market uncertainties. During the same period, cryptocurrencies showed a similar behavior as BTC prices recovered from their low. Following the outbreak of the coronavirus, investors continued to view Bitcoin as a safe-haven asset as global equity markets remain cautious.
Chart 2 shows the close relationship between gold and bitcoin prices during periods of uncertainties in early January. The upward trajectory in both markets indicates the demand for safe-haven assets.
Although Bitcoin lacks a long track record as a store of value, it shares similar properties to gold, such as limited supply and is difficult to mine.
With lingering macro uncertainties and an imminent bitcoin halving, the ongoing uptrend in crypto markets looks set to continue.
Binance Futures perpetual markets performance
In January, Binance Futures’ perpetual markets generated positive returns for investors. With its most popular contract, BTCUSDT recorded a 29.89% return in January. Among the Altcoin perpetual contracts, BCHUSDT recorded the highest gain for the month as investors anticipate the upcoming block halving.
Other Altcoin perpetual markets such as ETHUSDT, also saw a significant jump in market value, increasing by 45.74% to $180 per contract. In general, most altcoin perpetual markets displayed a steady performance in January, with the exception of XLMUSDT, which was only added to the Binance Futures platform on January 20th.
Chart 3 - Binance Futures’ perpetual markets performance in January

Source: Binance Futures
Many market analysts believe that one of the reasons behind the strong performances of altcoins was due to its low valuation. As prices bottomed in late 2019, mid to small-cap altcoins presented a value-driven opportunity for investors.
Binance Futures’ growing volume and open interest
Binance Futures volume grew by 85% from the previous month, with $56 billion traded on the platform. The platform displayed a daily average of $1.7 billion in volume while achieving its highest single-day volume of $3.5 billion.
Chart 4 - Trading volumes in January across Binance Futures perpetual contracts

Source: Binance Futures
With new contracts added, Binance Futures grew its open interest beyond the $200 million mark, an expansion of more than 90% from $137 to $271 million as of 31st January. BTCUSDT’s perpetual markets remained the most invested contract, dominating 72% of its total open interest. Open interest in BTCUSDT contract has grown over 50% in January.
Chart 5 - Binance Futures open interest breakdown as of January 31st
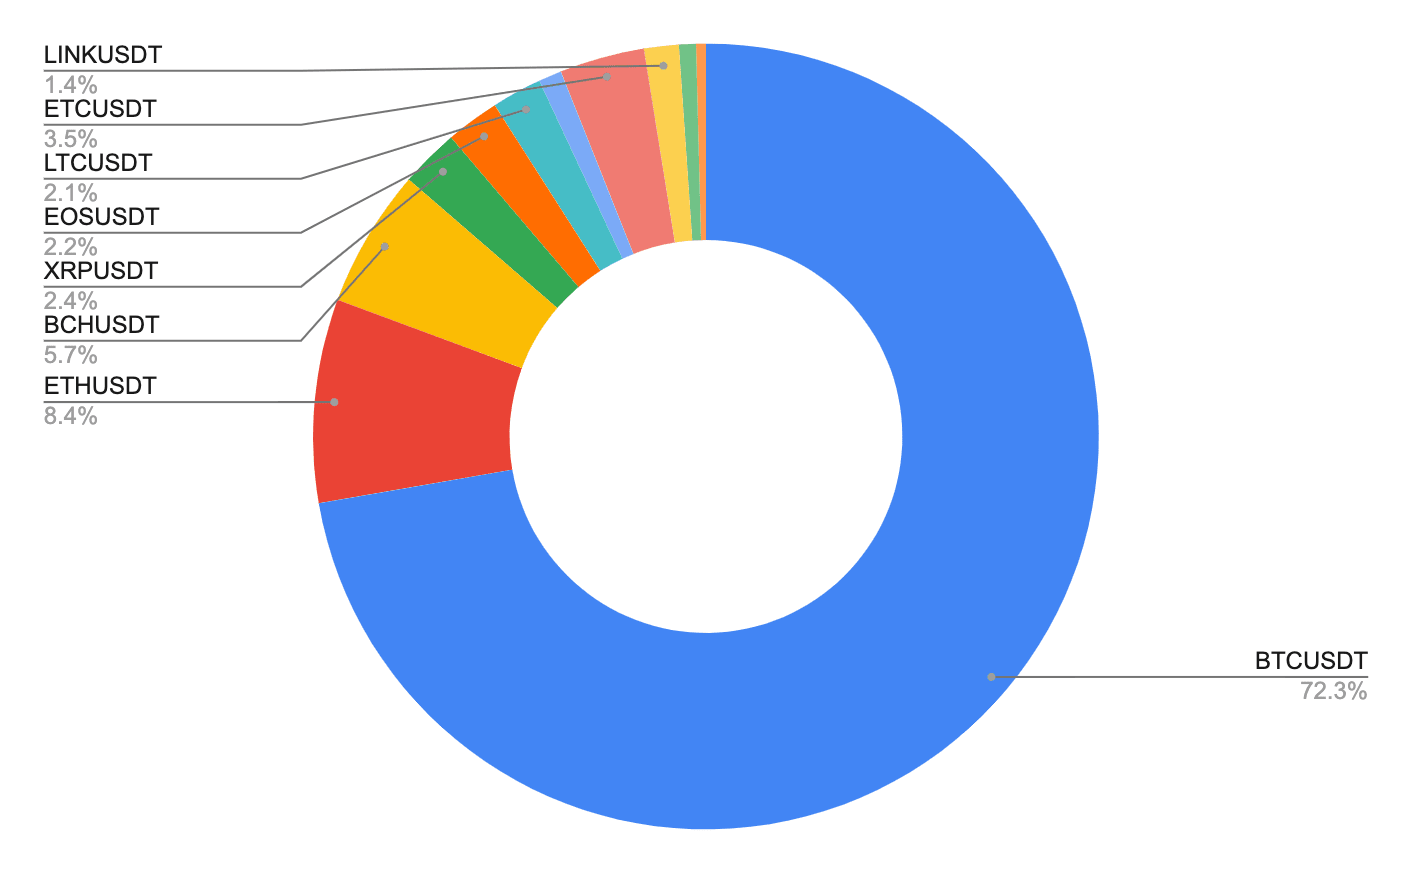
Source: Binance Futures
Binance Futures’ growing volume and open interest indicate more capital inflows and greater market participation. With the combination of increasing volume, open interest and prices, we can draw a probable conclusion that the crypto bull market is still going strong.
Additionally, the growing volume and open interest on Binance Futures also translates to greater liquidity on the platform. Thus, traders can transact orders efficiently and quickly with little or no price impact.
To understand more about open interest, please refer to What Information Does Open Interest Convey?
Sentiment indicators: Analyzing risk hedging behavior and traders’ positioning
As BTC uptrend continues, more traders are becoming bullish as they seek to capture its upside momentum. As such, traders are waiting on the sidelines to enter long positions on BTCUTSD at retracements, which is commonly known as buying the dip. We can observe this behavior by comparing BTCUSDT Long/Short ratio against the daily net change in BTC prices.
Chart 6 - BTCUSDT Long short ratio vs. daily net change

Source: Binance Futures
Over the 31-day period, we observe the near inverse relationship between the two indicators. In particular, a spike in the Long/Short ratio coincides with consecutive down-days in BTC prices. This may suggest that traders are positioning themselves to jump onboard the bitcoin bull market.
Furthermore, we observed less hedging activity on our platform. The maker to taker volume ratio on Binance Futures reached a high of 0.9x from 0.5 at the beginning of the month. The close relationship between the ratio and daily net returns in BTC prices suggests that traders were not actively risk-hedging, as the broader cryptocurrency markets rallied.
Chart 7 - Maker/taker ratio vs BTC daily net returns
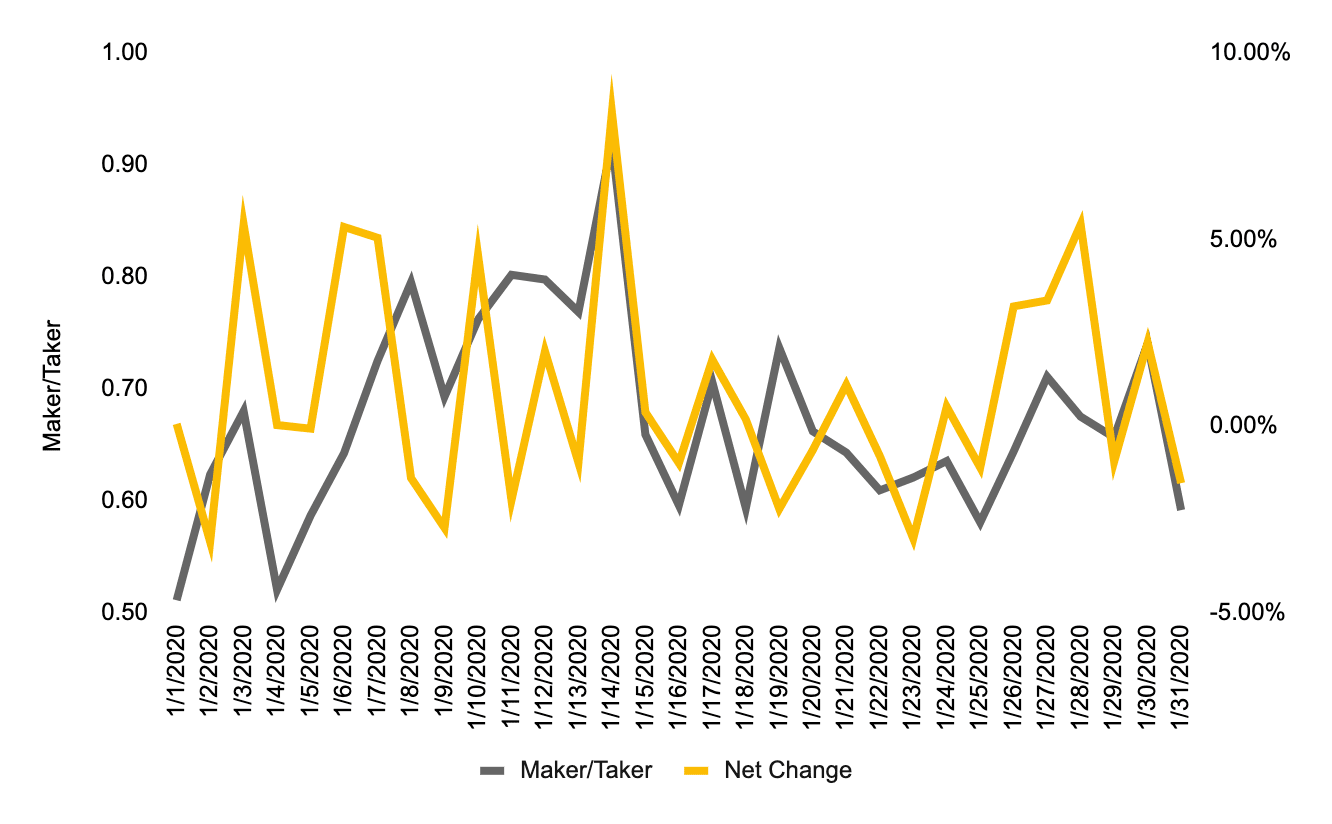
Source: Binance Futures
Chart 7 shows daily trading volumes in tandem with daily price fluctuations, a common observation in up trending markets. In contrast, in periods where traders are risk-averse, the two indicators tend to diverge. As the go-to venue for risk hedging among crypto traders, analyzing hedging behavior on Binance Futures serves a good indicator of risk aversion.
Leverage profile of traders on Binance Futures
In January, 70% of traders on Binance Futures trade with leverage between 20x to 40x (refer to Chart 8). Additionally, less than 10% of users trade with 100x or more leverage, decreased by half since December. During the month, 80% of users trade with leverage of less than 40x, a significant increase from 50% in December. Overall, the leverage profile of users has been more conservative as compared to December 2019.
Chart 8 - A 30-day average of leverage usages on Binance Futures

Source: Binance Futures
In summary
Following an abysmal Q4 in 2019, cryptocurrencies have made a phenomenal comeback in January 2020. The resurgence of cryptocurrencies was driven by two main themes: Bitcoin’s halving and the demand for safe-haven assets.
As such, the broader crypto market has generated positive returns for investors.
Crypto-derivative platforms such as Binance Futures saw a jump in trading activity as traders seek to participate in the rising trend.
With increasing volumes, open interest, and rising prices, we can deduce that market sentiment on cryptocurrencies is bullish. As shown earlier, traders on the Binance Futures platform are less engaged in hedging activity. Instead, traders are looking to position themselves to ride on the uptrend.
Going forward, Binance Futures will add new features and expand its product offerings that will provide users with additional trading opportunities and capitalize on the bull market.