Currently, the price of Bitcoin is at a key technical support level, near the 200-day moving average, and the RSI indicator shows that the market has entered the oversold area. This article will analyze the technical form and key indicators of Bitcoin in detail, and explore its future trends and operation strategies.
Importance of 200-day moving average:
1. Long-term trend:
The 200-day moving average is often viewed as an important indicator of long-term trends.
When prices are above the 200-day moving average, it indicates that the market is in a long-term uptrend; when prices are below the 200-day moving average, it indicates that the market may enter a long-term downtrend.
2. Support and resistance:
The 200-day moving average serves as a strong support level. Prices often encounter strong buying support here and may stabilize and rebound.
If prices break below the 200-day moving average, it usually triggers more selling, further accelerating the decline.
Current chart analysis:
Price Position: Bitcoin price is close to the 200-day moving average and has fallen below all short-term moving averages (20, 50, and 100).
Technical pattern: Combined with the M top pattern, the current price is below the neckline and close to the 200-day moving average, and the 200-day moving average becomes a key support level.
RSI Indicator: The RSI is at 30, which shows that the market is oversold and may see a rebound near the 200-day moving average.
key point:
Support Confirmation: If the price stabilizes and rebounds above the 200-day MA, it will confirm the 200-day MA as a strong support and the market is likely to resume its uptrend.
Breakout Risk: If prices continue to decline and break below the 200-day moving average, it will be a major bearish signal that could trigger further selling pressure.
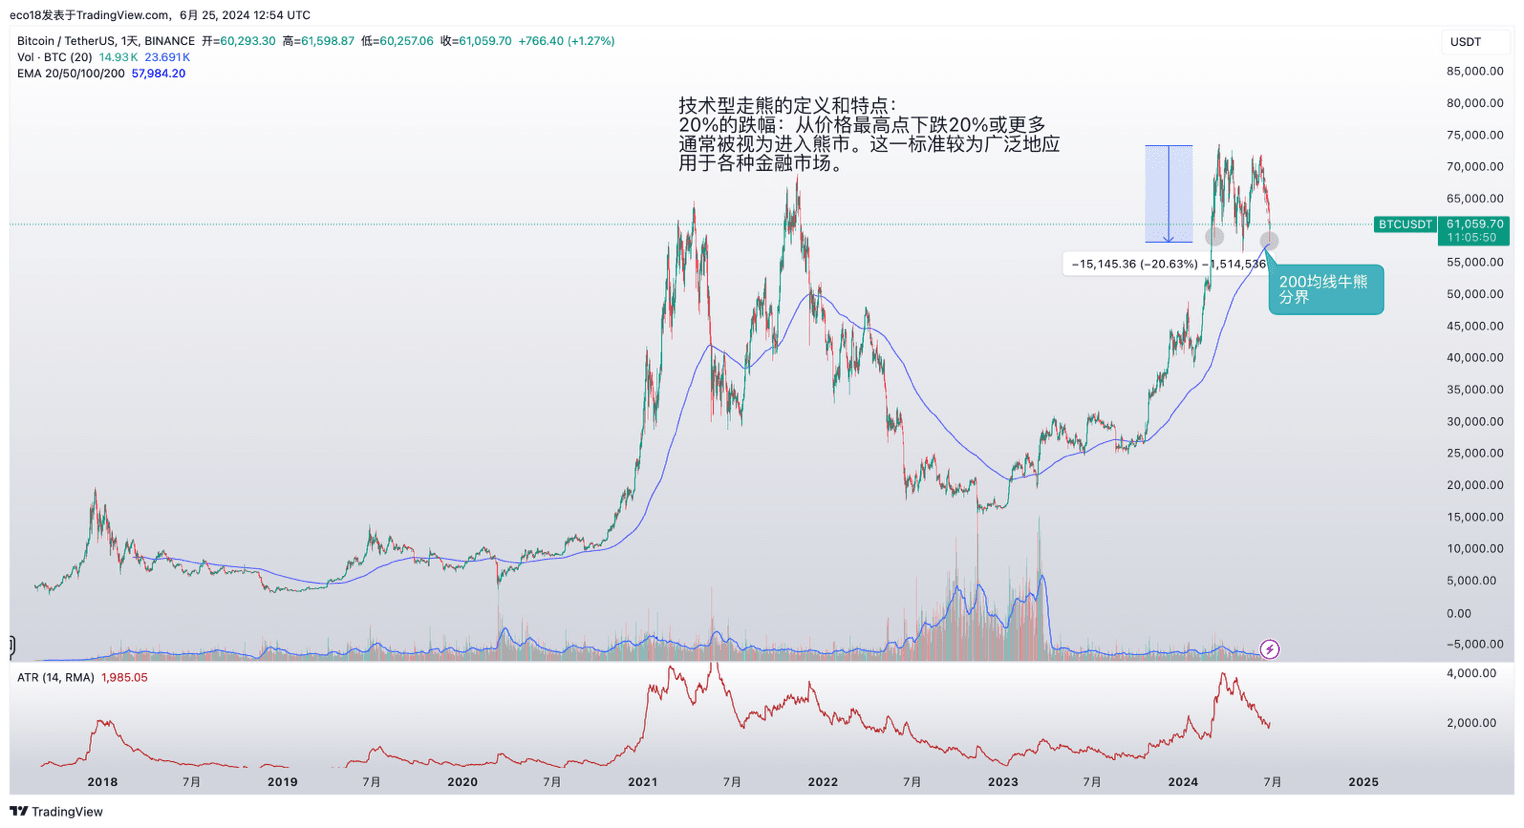
Definition and characteristics of technical bear market:
1. Decline standard:
20% decline: A decline of 20% or more from a price peak is generally considered a bear market. This criterion is widely used in various financial markets.
2. Technical indicators:
Long-term moving average: When prices break below the 200-day moving average and continue to hover below it, it is often a sign of a bear market.
RSI: The relative strength index (RSI) remains below 30, which indicates weak market momentum and may also signal a bear market.
3. Market sentiment:
Volume: In a bear market, volume usually declines as market sentiment turns cautious and investors tend to wait and see or sell.
Volatility: Volatility tends to increase in bear markets, with price movements being more volatile and erratic.
Operation suggestions:
1. Long order strategy:
You can consider opening long positions in batches near the 200-day moving average and set a reasonable stop loss to prevent the price from falling further.
2. Short order strategy:
If the price falls below the 200-day moving average, you can consider shorting, with the target price at the target measured by the M-top pattern. Pay attention to the rebound risk and adjust the stop loss at any time.
Risk Management:
Set stop loss: Whether long or short, you should strictly set the stop loss to control risks.
Pay attention to trading volume: At key support or resistance levels, changes in trading volume often indicate the further direction of prices and should be closely monitored.
Summarize:
The 200-day moving average is currently an important technical support level for Bitcoin, and the market’s reaction will determine future trends.
Investors should pay close attention to the price performance near the 200-day moving average and combine it with other technical indicators such as RSI to make reasonable trading decisions.
 #BTC走势预测 #BTC走勢分析 #Bitcoin❗ $BTC