Then I will review this wave and tell you why we dared to buy BOME at 0.008, and continued to build positions at 0.0082, and sold directly at 0.011 (of course, it has nothing to do with the reversal of Brother Milk, I just ran away when I saw that the volume and price were not right)
In the review, there is also the WIF short call in May, the long call at the end of June, and the last opportunity to run away in August. There is also a question that everyone is concerned about: Why did WIF rise higher than BOME? (For the pre-emptive news about WIF, you can see the quoted tweet)
Yesterday, I helped you to check the market. If you understand the most basic content of volume and price, you will definitely not buy the targets you issued, and you will not be trapped by 80%. So why did we choose WIF and BOME, and can we recognize that WIF is stronger than BOME? Why don’t we buy a series of junk coins such as strk, ena, etc. (because they have been distributed)
You need to be familiar with Wyckoff's three principles: supply and demand, effort and results, and cause and effect.
Especially the effort and results, which are the core principles for entry and exit. Many people say that Wyckoff volume and price do not contain entry and exit content, but as long as you understand the effort and results, then you will find the reversal point, and the reversal point is an entry and exit point.
Supply and demand principle: when demand is greater than supply, the market will rise, and vice versa. When supply and demand are balanced, the market will fluctuate.
Effort and Results: Effort = Results = Trend continuation, Effort > Results = Possible reversal, Effort < Results = Easy move.
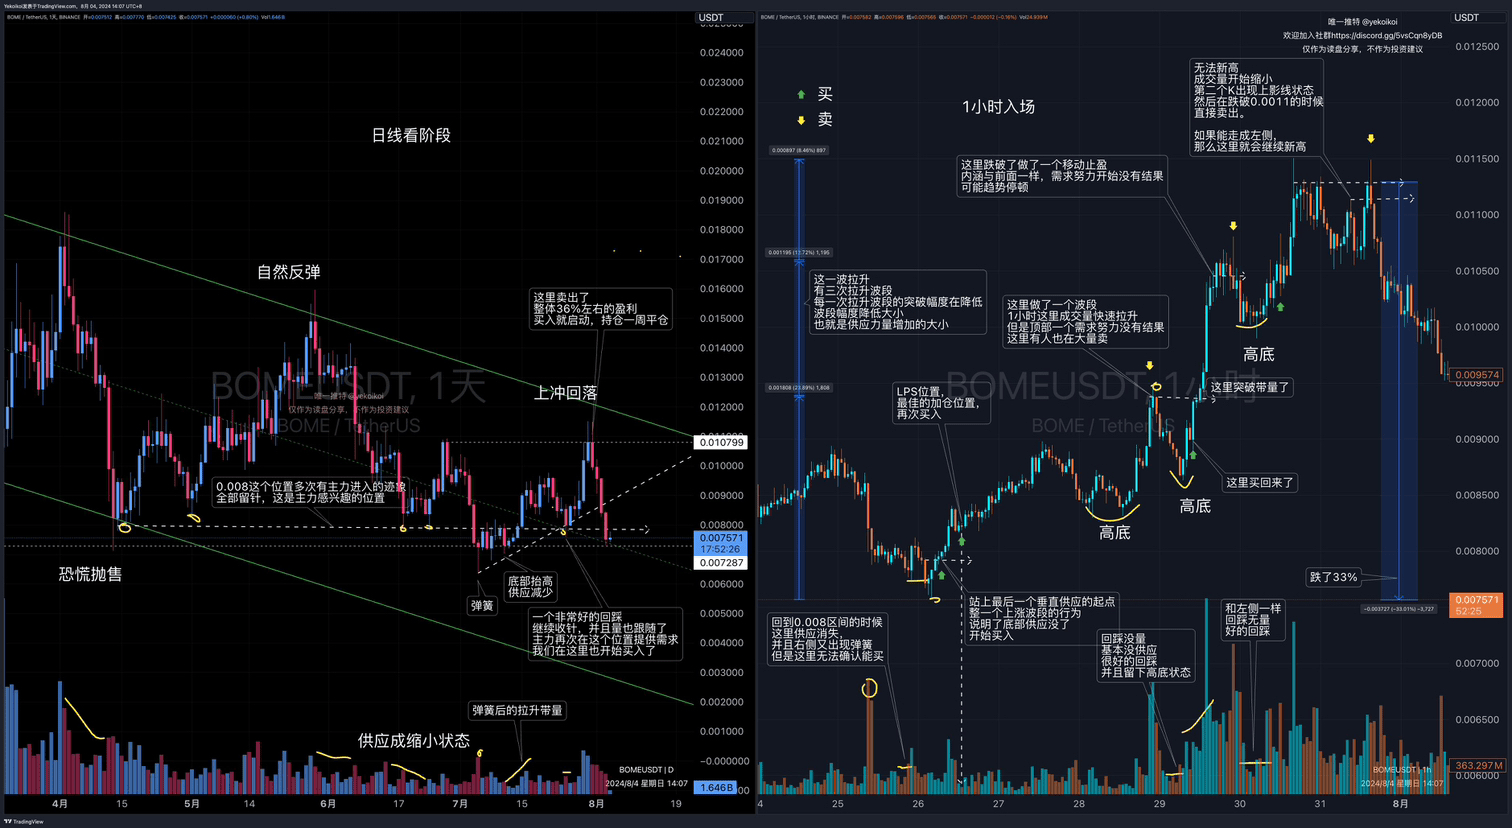
BOME daily line:
1. The downward channel of the large structure, an oscillating downward structure at the 3-day line level, may currently be able to develop into a fund-accumulation structure, rather than being certain that it is already accumulating funds.
2. Observe the behavior of the main force. The needles are all bought by the main force. Within 3 months, the main force has made a lot of moves in the range of 0.008.
3. The spring volume closed at a high level, the price difference of K was large and the price range was small, which showed the control of demand. The subsequent K bottom was raised and the supply decreased, so this wave of 3-day line was a shake-out behavior.
4. The subsequent pull-up volume is maintained, the volume and price are synchronized, and the volume is less when it falls back than when it rises, which means that the supply is small. When the price falls back to the range of 0.008, the lower shadow line continues to appear, and the main force enters again.
5. When it starts to rise rapidly, the trading volume quickly increases, and it approaches the upper boundary of the falling channel, it starts to sell. This is not a good phenomenon. The supply begins to reduce the price, and the market is not sustainable. This is the daily information. Why do we need to look at the 1-hour line? Because of Wyckoff's causal principle: the stronger the "cause", the stronger the "effect". There is no obvious accumulation of funds in this wave. We only see the "cause" of a shakeout behavior. Then the corresponding "effect" ends after a certain daily level volume and price behavior appears.
BOME 1 hour:
1. After confirming the shake-out behavior, we tried to find the entry point in vain. After the initial spring appeared in 1 hour and broke through the starting point of the vertical supply line of the last wave of decline in 1 hour, it means that the bottom supply has completely disappeared and demand has begun to control the bottom price.
2. It rises quickly, but cannot complete the 1-hour V-reversal. Then when it retraces to a K-line with shrinking volume, it adds positions again. The extremely small trading volume of this K line shows that no one is willing to sell here, and the price remains at a high level, at the high bottom state at the hourly level.
3. The subsequent rise continues to fall back, and there is no volume when the price falls back, and a high bottom state appears, and the trend continues.
4. Two choices of waves: The first time: 1 hour of efforts had no results, someone sold a lot here, I also followed to sell, the subsequent retracement continued to have no volume, and then bought back, about 4% of the wave. The second time: the same volume and price behavior as before, 1 hour of efforts had no results, someone was still selling, the subsequent retracement also had no volume, I also followed to do the wave, about 2% of the wave. The breakthrough behavior between the waves is to pull up with volume. You must pay attention to the specific volume and price phenomenon of this breakthrough, which must be accompanied by volume.
5. Sell at last: The reason for selling is that the three-wave pull-up has decreased a lot. The efforts to increase demand at a high level have not yielded any results. The upward rush has fallen back and it has not been able to reach a new high. The demand is much less than on the left side. It subsequently fell below the key price position of 0.011. If the upward trend is to be maintained, it cannot fall below 0.011, otherwise a low bottom state will appear. Sell immediately after breaking below 0.011. Now it has fallen to the vicinity of the previous low, and a daily stop signal has appeared. This is a left-side behavior, and it is not yet at the stage of right-side intervention.
Why is WIF better than BOME?
If the review is inspiring to you, please give me a triple like~!
#BOME#WIF#WyckoffSupplyDemandQuantityPrice
☺️☺️☺️