[SOL price trend analysis] 4-hour price trend: sideways
1. K-line pattern:
-The recent 4-hour K-line shows that the price fluctuates greatly, and there are many K-lines with long upper and lower shadows, indicating that the market is in fierce competition between buyers and sellers in this price range
-From the daily K-line, there was a continuous rise from March 30 to April 1, but the latest K-line is a small negative line, which may indicate that the upward momentum is weakening
2. Technical indicators:
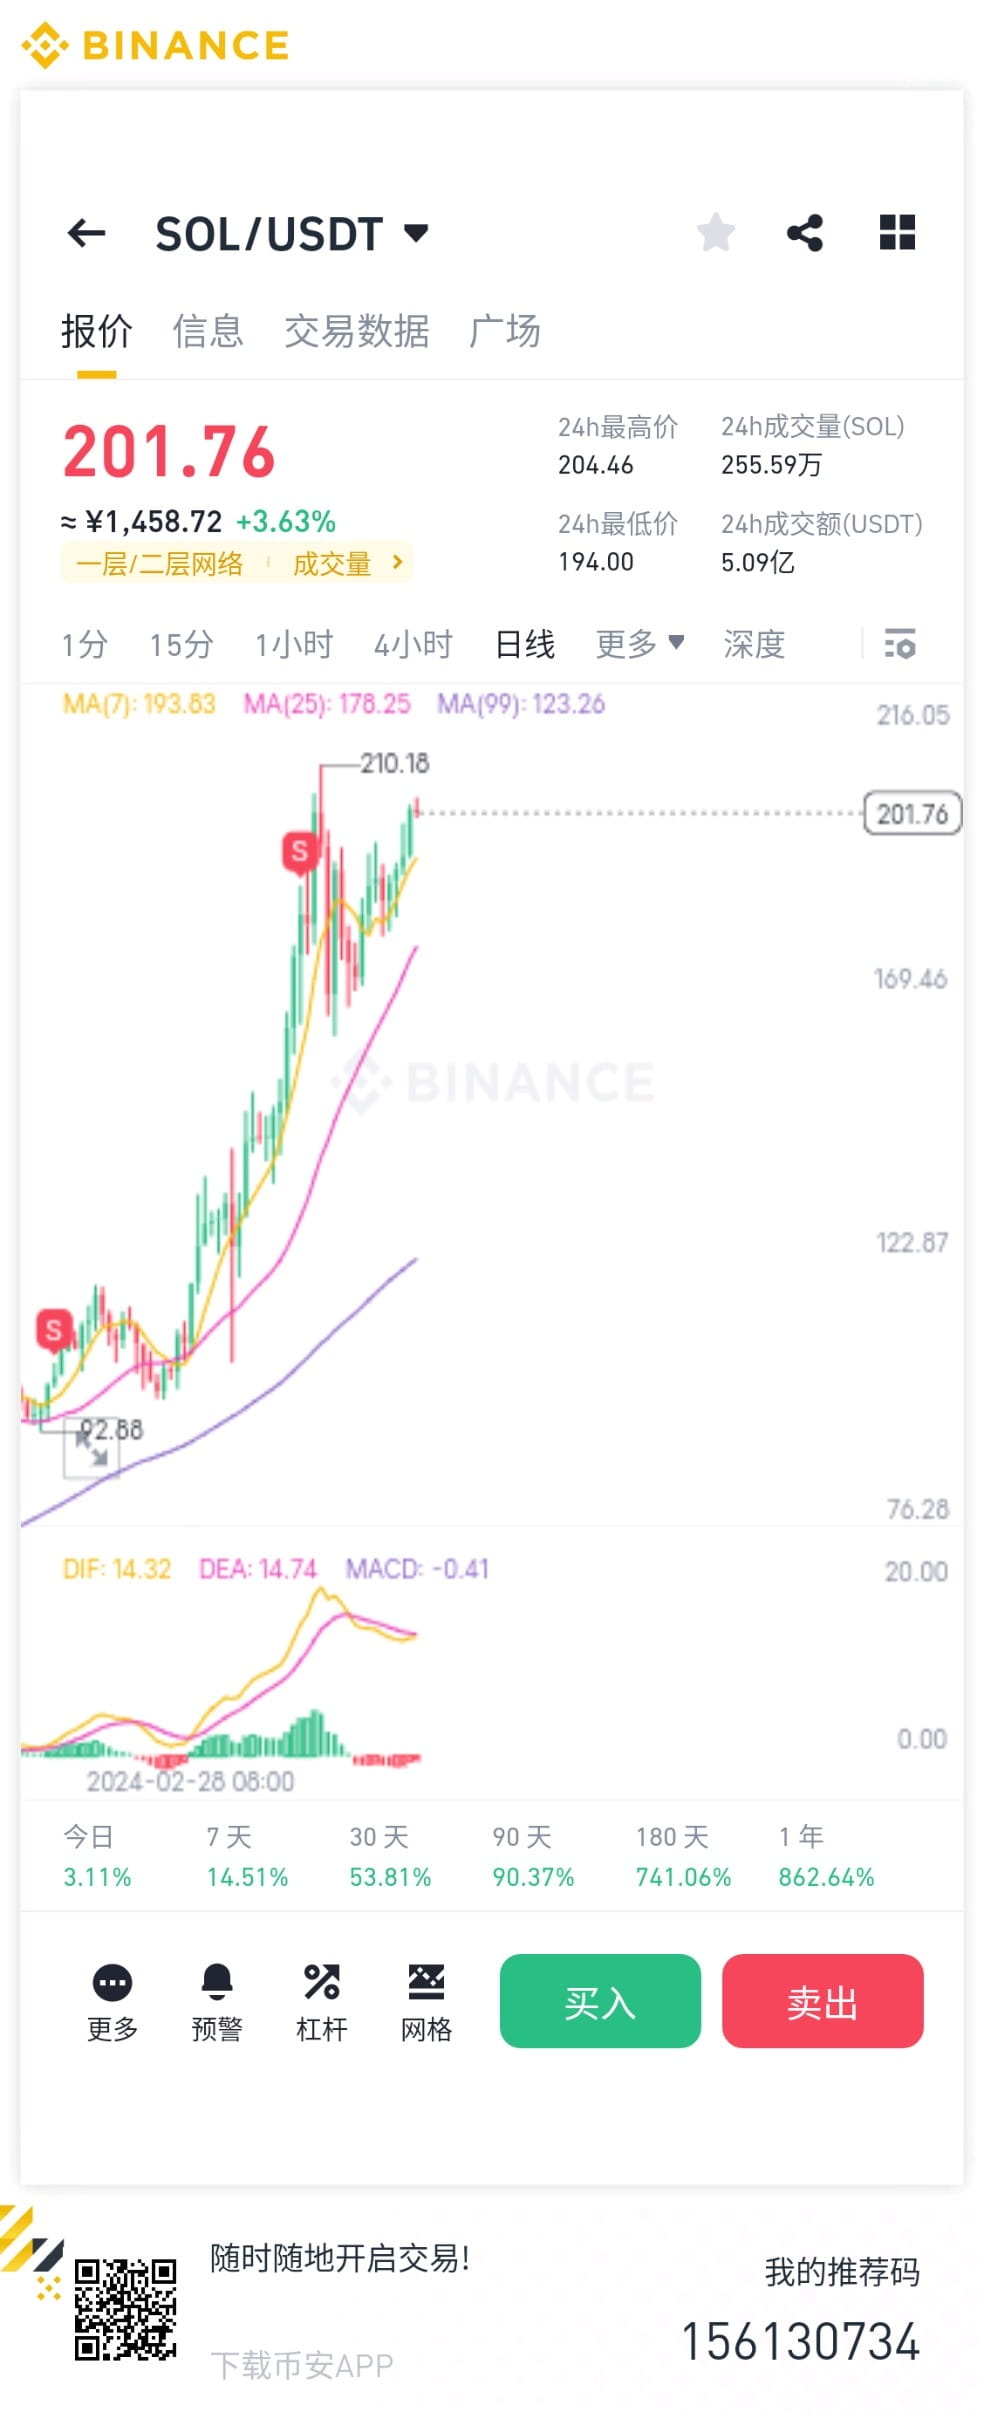
-In the MACD indicator, DIF and DEA are both in the positive area, and the MACD bar chart shows a shrinking state, suggesting that the current upward trend has slowed down
-The KDJ indicator shows that both the K-line and the D-line are running at high levels, and the J-line is slightly overbought. If the K-line and the D-line have a dead cross, it may be a callback signal
-EMA7 line is always above the EMA30 line, indicating that the short-term trend is relatively strong, but the gap between the two is gradually narrowing. It is necessary to pay attention to whether the short-term moving average will cross the long-term moving average downward
3. Trading volume:
-In the 4-hour cycle, the trading volume increases when the price rises and decreases when the price falls, which conforms to the conventional relationship between price and trading volume
-At the daily K-line level, the trading volume has decreased in recent days compared with the previous period, which may mean that the upward momentum is insufficient, and it is necessary to be vigilant about the possible price callback risk in the future