The original golden ratio had only one ratio, which was 0.618 or 61.8%. It represented the development of aesthetics: when a painting, a photo, or a setting conforms to the golden ratio, it can present the most comfortable aesthetics. Technical analysis masters Gann and Elliott both included the golden ratio in their toolboxes, because both believed that the golden ratio not only represents the field of aesthetics, but also represents the evolutionary laws of the entire material world.
As more and more people study Gann Theory and Wave Theory, the research on the golden ratio has become more and more in-depth, and finally a group of people who specialize in using the golden ratio for investment has been formed.
Professional users of the golden ratio not only use 0.618, but also other ratios. The reciprocal of 0.618 is 1.618, and 1 minus 0.618 equals 0.382; 0.618 times 0.382 is 0.236, and 1 minus 0.236 equals 0.764; and the distance between 0.618 and 0.382, multiplied by 0.618 and added with 0.382, equals 0.5 percentile. Therefore, in a complete set of golden ratios, the numbers 0.236, 0.382, 0.5, 0.618, 0.764, 1.382, and 1.618 are often included.
The author is not a fan of the golden ratio and believes that it is not necessary to calculate the ratio to three decimal places. There will be no significant difference between using a ratio of 60% and using a ratio of 61.8%.
Traditional investors who use the golden ratio believe that during an uptrend, a retracement of less than 38.2% means an insufficient retracement; a retracement of around 50% represents a sufficient retracement, which may very well start a second uptrend; a retracement of more than 61.8% represents an excessive retracement, and the probability of a bullish trend turning into a bearish trend increases.
Logically speaking, such a proportion division and interpretation is very reasonable, but if actual operations are carried out according to such interpretation, huge losses will occur because it does not conform to the actual situation.
According to my experience, most trending markets have the following rules, taking the bullish trend as an example:
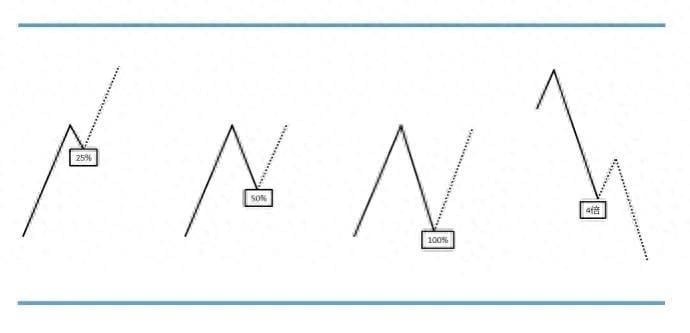
1. Only when the retracement is less than 38.2%, or more strictly, less than 25% (the ratio used by the author), is it more likely that a second round of stronger trend market will occur. The smaller the retracement, the higher the probability of a second round of larger and smoother rise.
2. As long as the correction amplitude is greater than 50%, it means that the strength of the bulls has weakened and the strength of the shorts has increased. It will be difficult for a second round of trend market with higher intensity to appear in the future. When the 50% callback line is touched, there is a high probability of a volatile trend in the future, which means that the power of short selling has reached about half of the power of long selling, and the significant advantage of the bulls has disappeared. This kind of shock is often a small to medium amplitude shock, ranging from the low point of the callback band to the high point of the rising band.
3. If the callback amplitude is greater than 50%, whether it reaches 70% or 90%, it means that the future market will experience significant fluctuations, because the bulls have been completely defeated by the bears, and the two sides are deadlocked and can only engage in a large-scale tug-of-war. At this time, the fluctuation range is in the overlapping area of the bull band and the bear band.
4. If the short wave has broken through the lowest point of the long wave, and the amplitude of the short wave is greater than or equal to twice that of the long wave, the probability of small and medium fluctuations in the future market is relatively high. The fluctuation range is from the lowest point of the short wave to the lowest point of the long wave. To put it simply, it is the non-overlapping part of the long and short bands.
5. In extreme cases, the amplitude of the short band exceeds that of the long band and reaches 4 times the amplitude of the long band. This means that the short force completely dominates the current market trend, and the trend has changed from long to short. In the future, we will only define the new round of rise as a rebound, not the second round of trend rise. 4 times is a very large ratio. If the amplitude of the rising band is too large, it can be basically determined that the short band cannot have a 4-fold decline. Therefore, the prerequisite for the trend to turn is that the amplitude of a certain band of the trend is very small, which gives the counter-trend band a very good opportunity to achieve a four-fold amplitude.
The above five experiences have a unified core idea, which is the 50% dividing line. The dividing line here refers to the dividing line between the trend market turning into a volatile market and the dividing line between the long and short trends.
For the first one, the 25% ratio comes from 50%*50%=25%, which is equivalent to dividing the bull trend into four stages. If the callback band cannot even break through the first stage, it means that the bull strength is very high, and the probability of a second wave of bull band in the future is higher.
The second and fourth points are actually the positive and negative uses of the 50% ratio. The second point is very obvious and will not be explained in detail. For the fourth point, the reciprocal of 50% is 2, which is the double relationship between the long and short bands. The fifth point is actually a corresponding relationship with the first point. The reciprocal of 25% is 4, which corresponds to the quadruple relationship between the long and short bands. The third point is the most common use of the 50% ratio, so there is no need to over-analyze it here.
summary
Relying solely on the golden ratio to make transactions will not achieve the best results. It is necessary to combine it with other technical indicators for comprehensive analysis.