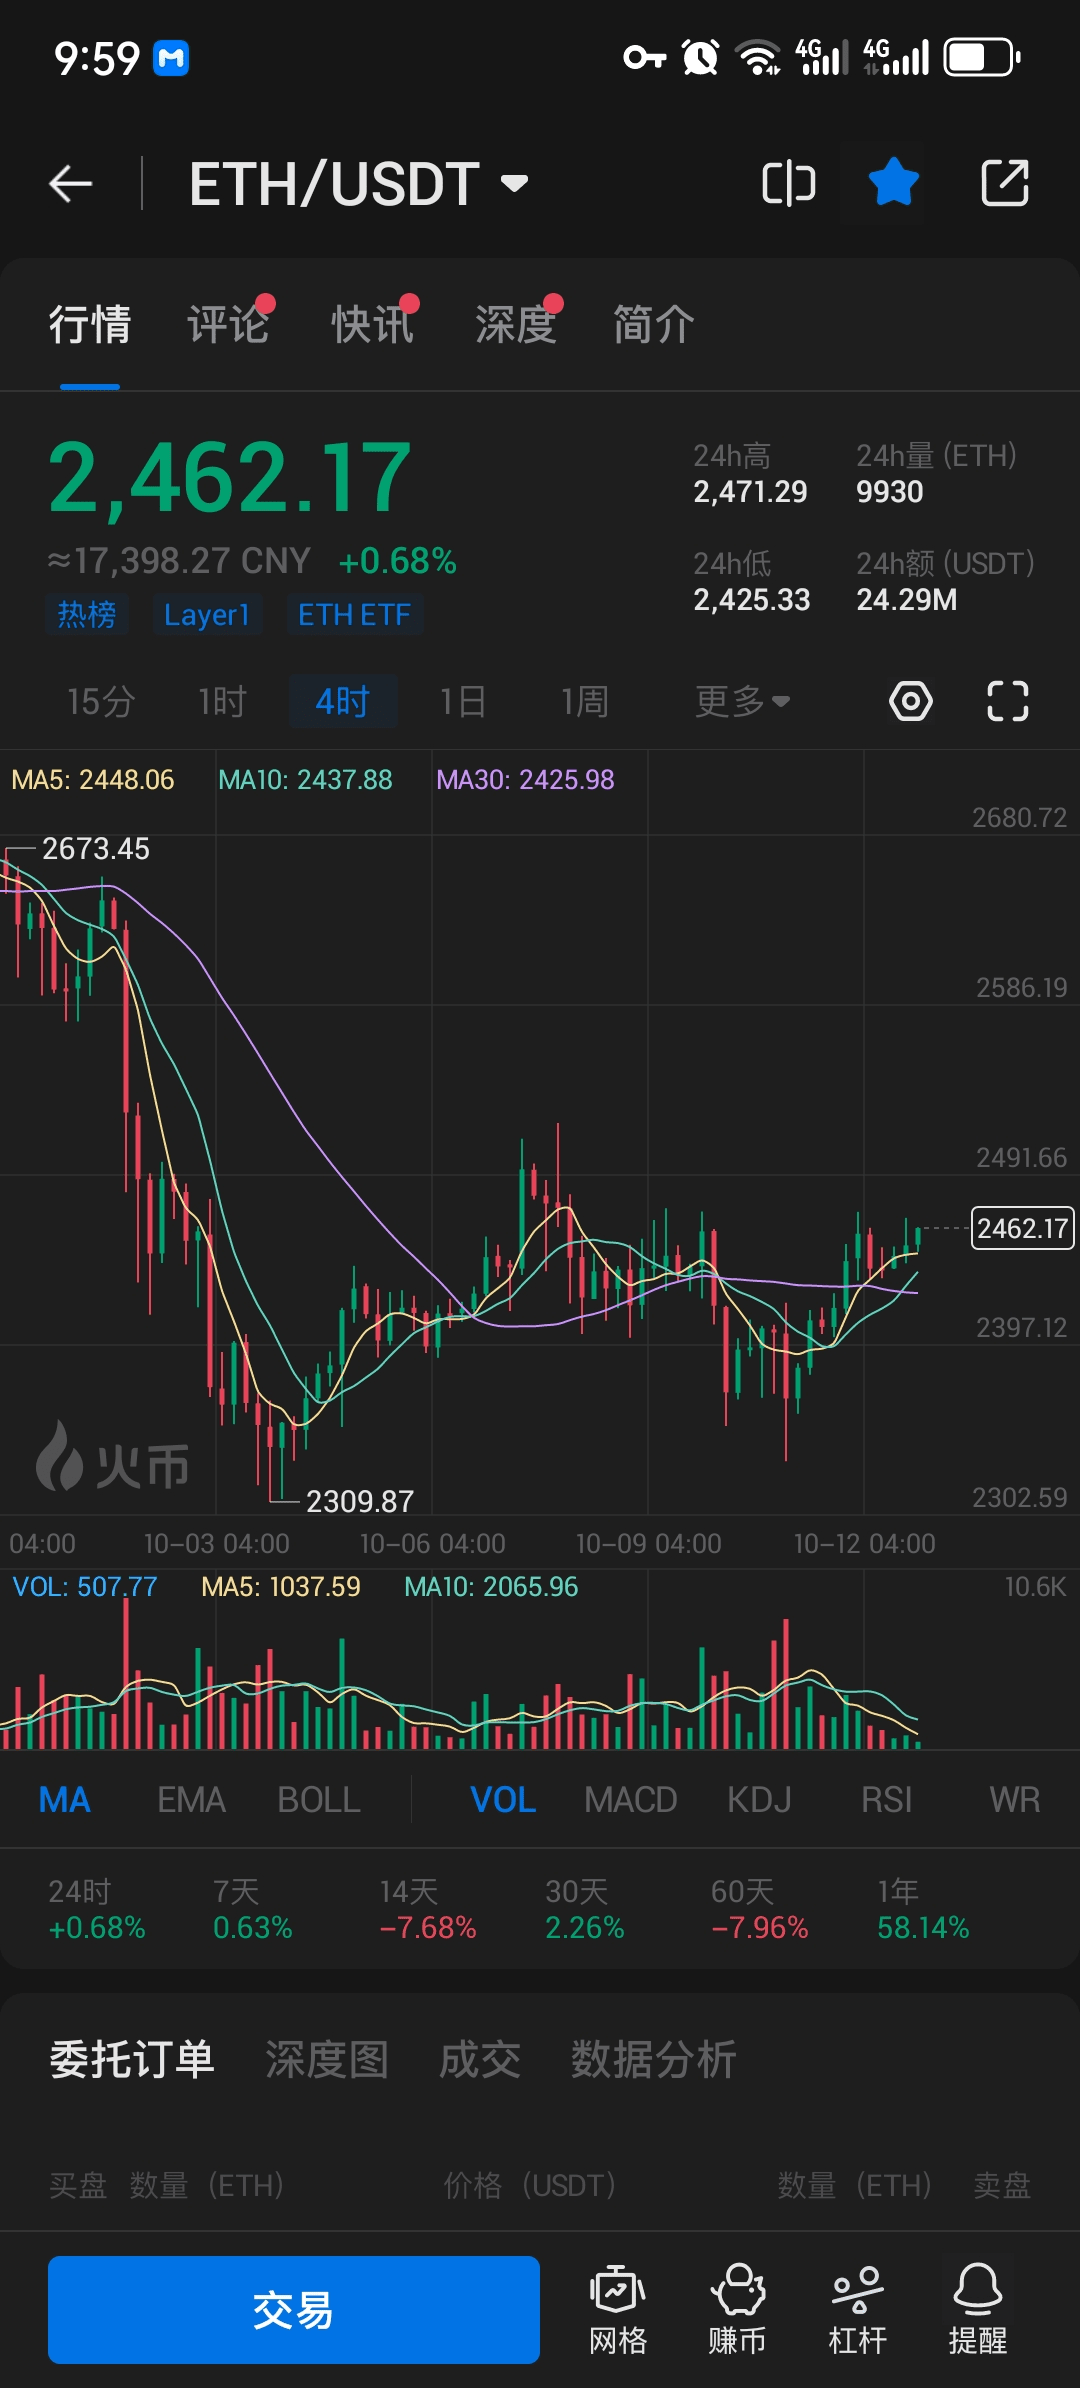
Ethereum's trend was affected by the negative impact of CPI. After a small correction to 2329, the trend rebounded, which did not affect the movement of the general trend. It rebounded all the way to a high of 2370, which was also the high point of several times before. The future trend will focus on the breakthrough of 2370.
From the four-hour Ethereum trend chart:
【Price trend analysis】
K-line pattern:
The recent K-line shows that the price fluctuates in the range of 2400 to 2470, with certain signs of shock consolidation.
The rebound after the long lower shadow appeared on October 11 indicated strong buying from below.
Technical indicators:
MACD: The current DIF line crosses the DEA line to form a golden cross, and the MACD histogram turns from negative to positive, indicating that short-term bullish power is increasing.
RSI: The RSI value is 56.64, which is in the neutral to strong area. It has not entered the overbought area, but has an upward trend.
EMA: The 7-period EMA (2439.16) has crossed above the 30-period EMA (2428.39) and is approaching the 120-period EMA (2468.51), indicating a positive short-term trend.
Volume:
Volume has increased in recent trading sessions, especially on October 11 and 12, indicating increased market activity.
The large volume increase accompanied by the price recovery indicates that capital inflows are pushing prices higher.
10/12 evening Ethereum stable short-term profit layout:
It is recommended to enter long orders near Ethereum 2450, with a short-term target of 2470. Continue to hold if it stands above!
If it is unable to stay above 2470, it is recommended to go short, with the target point being 2440-2420.$ETH #加密市场反弹