From the perspective of different time periods, the trend of Bitcoin can be summarized as follows:
First, looking at the daily chart, after Bitcoin fell to a low point in early July, although it rebounded, it encountered great resistance between $60,000 and $62,000. Although it has rebounded a little now, it is still a bit difficult to break through this range overall.
Looking at the 4-hour chart again, the trend of Bitcoin appears clearer, forming a W-shaped rebound structure, but it still encounters resistance near $60,000. At the same time, the range of $58,000 to $59,000 has also become a relatively stable support level, and the market has seen buying orders here many times.
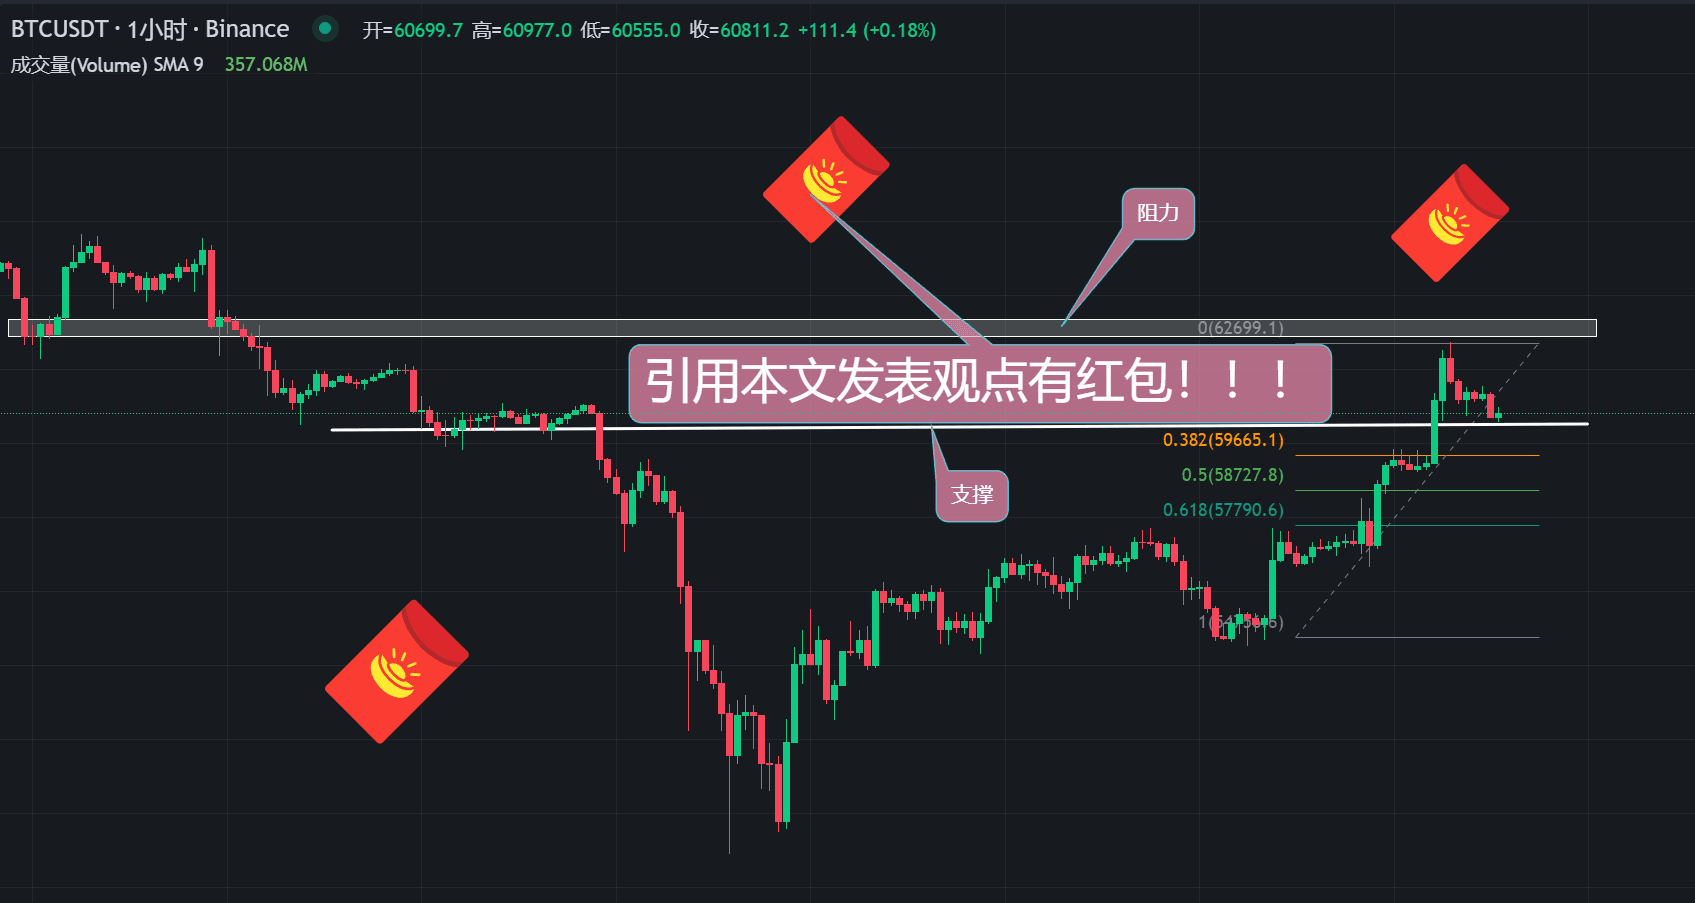
Finally, looking at the 1-hour chart, Bitcoin has been oscillating between $58,800 and $59,500 in recent days, indicating that the market is not clear about its direction in the short term. Now Bitcoin may continue to fluctuate slightly in the short term until there is new market news or a breakthrough signal.
In general, the current trend of Bitcoin is to oscillate back and forth below $60,000, and it is unlikely to fluctuate too much in the short term.
Next, pay attention to changes in key resistance levels and changes in trading volume. These are important references for judging subsequent trends.