


Last Friday's weak non-farm payrolls data caused a major earthquake in macro assets. After the data was released, asset prices fluctuated violently by multiple standard deviations, and the aftershocks continued into the new week.
Nonfarm payrolls increased by 114,000, one of the weakest data since the outbreak of the epidemic, and the figures for the first two months were also revised downward. The average hourly wage growth slowed to 0.2% month-on-month and 3.6% year-on-year. The unemployment rate unexpectedly rose to 4.25%. The unrounded value was close to the threshold (4.28%) that triggered the "Sahm recession indicator". The market was ruthless and risky assets were hit severely across the board.

In addition to the non-farm payrolls report, last week's economic data were also relatively weak. The US manufacturing index experienced the largest contraction in 8 months (-1.7 points to 46.8), mainly due to a decrease in orders and production and a decline in employment. Some industry comments seemed to indicate that an economic slowdown was taking place (Source: Bloomberg):
"The economy appears to be slowing significantly, sales calls from new suppliers have increased significantly, and our own order backlog is decreasing." — Machinery
"Demand continued to be weak in the second half of the year, and supply chain pipelines and inventories remained ample, reducing the need for overtime. Geopolitical issues between China and Taiwan and the November election remained a focus." — Transportation Equipment
“Sales volumes were down, customer orders were lower than expected, and consumers appear to be pulling back on spending.” — Food, Beverage & Tobacco Products
“Unfortunately, our business is experiencing its most dramatic decline in order levels in a year.” — Fabricated Metal Products
“Business is slowing and we are taking cost measures.” — Electrical Equipment & Appliances
“Some normally stable markets are now showing weakness.” — Non-metallic mineral products
“Rising financing costs are dampening residential investment demand, which is reducing our demand for component products and inventory.” — Wood Products

The market was caught in a multi-standard deviation sell-off. Tech stocks fell 2.5% on the day, chip stocks have plunged more than 20% since July, 2-year Treasury yields fell 26 basis points to 3.87%, VIX soared to nearly 30, and USD/JPY plunged to 145, almost giving up the whole year's gains in one go.
Bond traders and the Fed Funds futures market quickly lowered forward rate expectations, with JPM and Citi expecting 50bp cuts in September and November, and another 25bp cut in December, for a total of 5 full cuts by the end of the year. The 2-year yield is at its most inverted level to the policy rate since the global financial crisis, and the market believes that the Fed is lagging far behind the curve, but we do not necessarily agree with this view, but rather believe that the interest rate trend is somewhat overreacting.
Some readers may remember the market's obsession with using an inverted yield curve as a recession signal, but as we mentioned before, this itself is not a very useful signal, and we have experienced more than 500 days of inversion without any recession. However, what is more worrying is that when the market "admits" that the economy is starting to slow down and starts to price in rate cuts and buy bonds in the short term, the curve immediately after inversion will have a dangerous bull steepening trend, which is exactly what is happening now.
This may partly explain why the market reaction this time was so dramatic compared to previous instances when data came in below expectations and bonds rallied.
Similar to other asset classes, cryptocurrency prices have plummeted, with BTC falling 20% last week, nearly wiping out all of its gains since the ETF was announced in January, ETH falling into the $2,000 range, and altcoins also falling 30% to 50% over the past week.
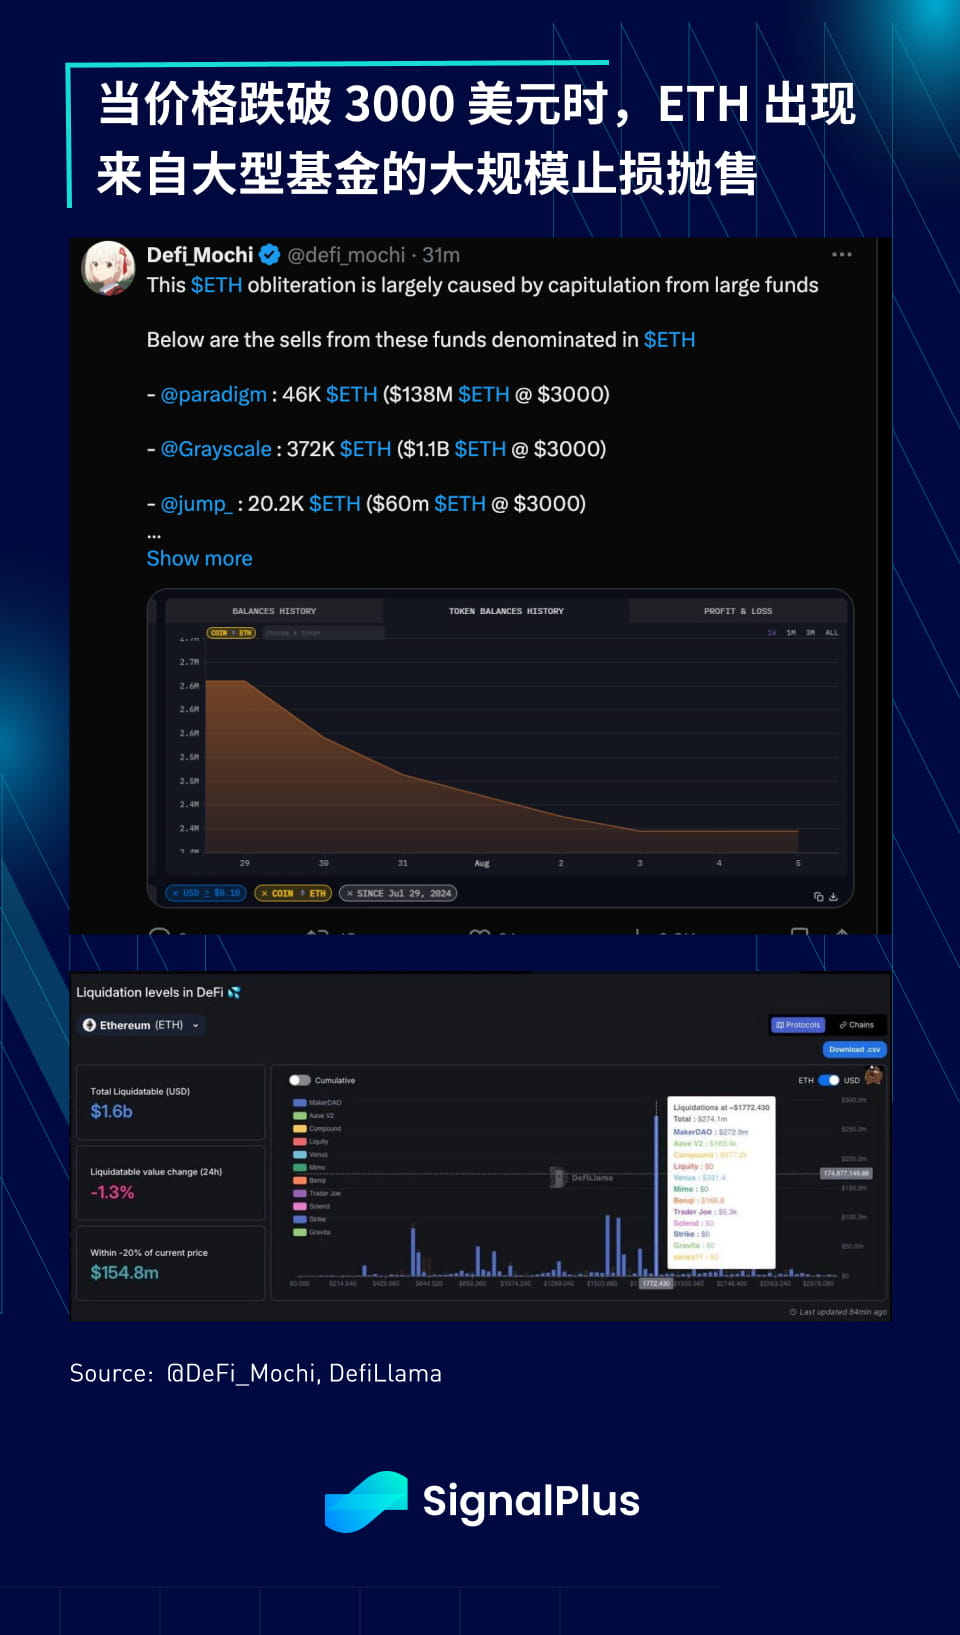
We can certainly blame the price drop on weak ETF inflows (especially for ETH), but crypto is ultimately showing that what it really represents is the “leveraged Nasdq index” and the price is simply “catching up” with the tech stocks’ decline since early July. In addition, when the price fell below the 3000 mark, P&L protection and risk stops by large funds led to over $1 billion of ETH selling.


The prediction of the trend of cryptocurrencies is actually a prediction of the trend of US growth stocks, and by extension, a prediction of whether a recession is imminent, that is, whether 4.5 interest rate cuts before the end of the year are reasonable. Although the US growth trajectory is slowing down, we have not seen any actual "hard" data close to a recession, and we believe that it would be unwise for the Fed to respond to drastic changes in market sentiment, which would only be counterproductive to increasing market confidence.
After all, weren’t we talking about a “no landing” (i.e. growth) scenario just a few months ago? Moreover, with the US election just around the corner, can the Fed really cut rates by 100 basis points under political cover when the Atlanta Fed GDPNow still forecasts 1.8-2% GDP growth in the third quarter?
The main damage of this wave has been done, and the Fed has an opportunity to reassure the market and avoid sounding the alarm of a crisis at the upcoming important Jackson-Hole meeting.
Wishing you all the best during these difficult times.


