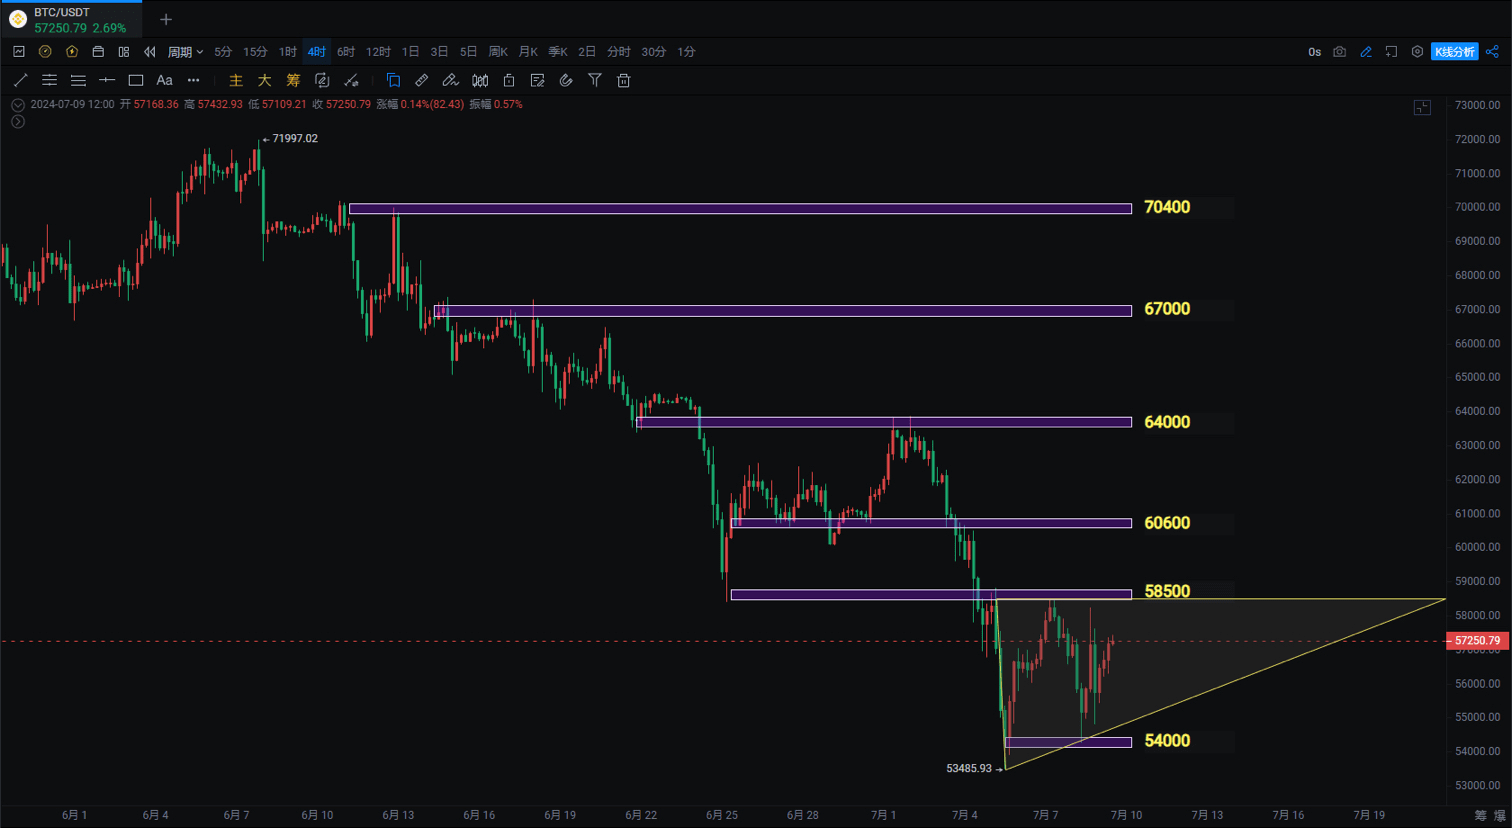
24/07/09BTC fluctuates near the weekly support. Is it a stop or a downward relay? Is the short risk still not eliminated?

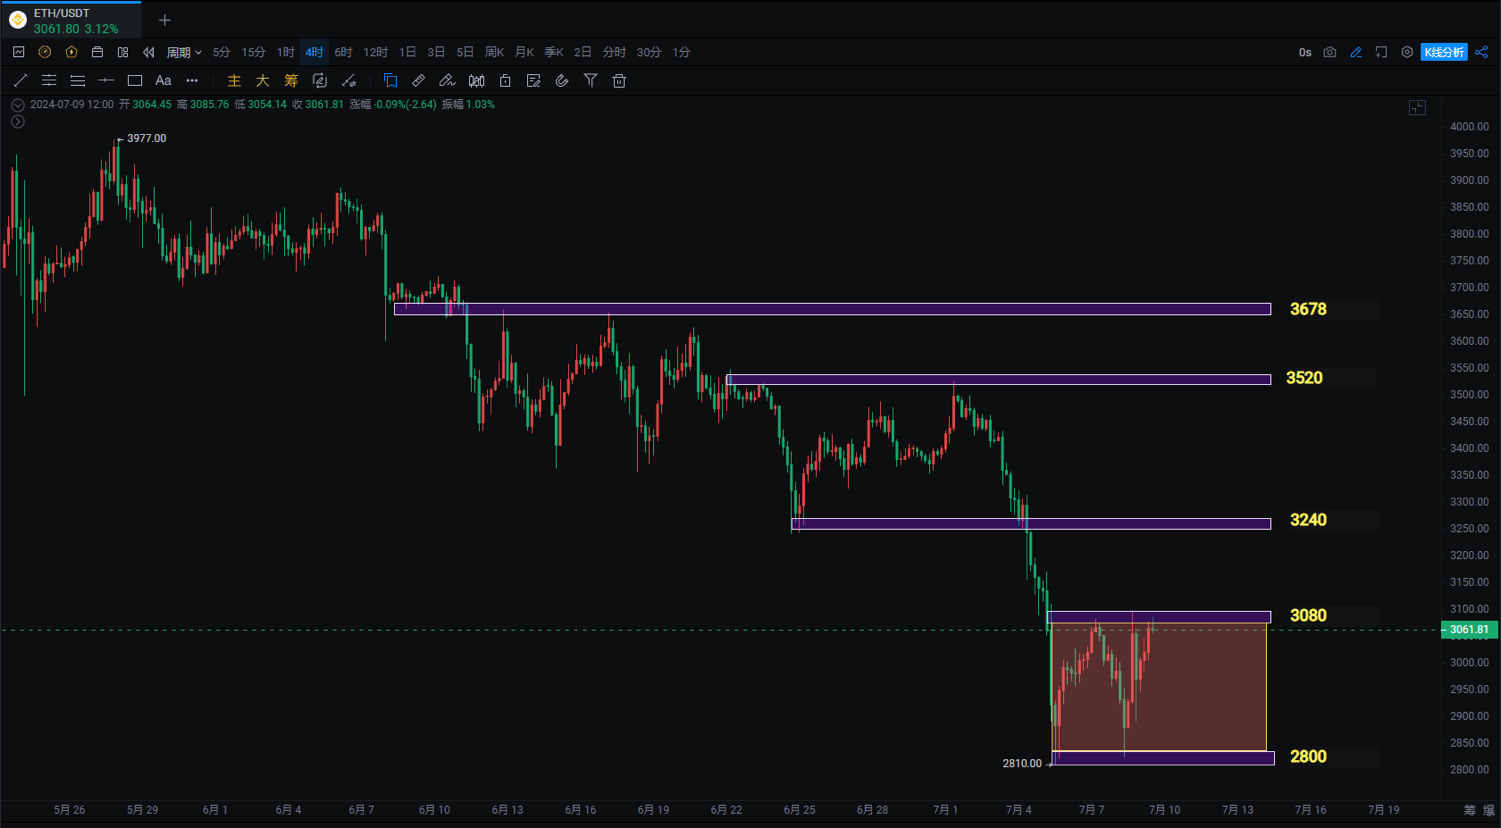
Yesterday it dropped to 54260 again and rebounded quickly to 58236. In the evening it quickly dropped to 54800. Currently, it has formed a triangle pattern in the short term. The price line has been oscillating around the weekly support of 56552. Ethereum fell back to the bottom support of 2800 on the weekly line, and the 4-hour and 1-hour short-term lines formed a box-shaped oscillation.
The large-cycle daily and even weekly lines have not stopped falling, and are still in a downward relay. To stop the decline, there must be a clear reversal signal and an effective breakthrough of the upper pressure of 60,600. I will regard it as a stop decline and rebound. Otherwise, it is still a downward relay, and it is also possible to replicate the trend of 24,900, which is also short of a drop and recovery to be effective.
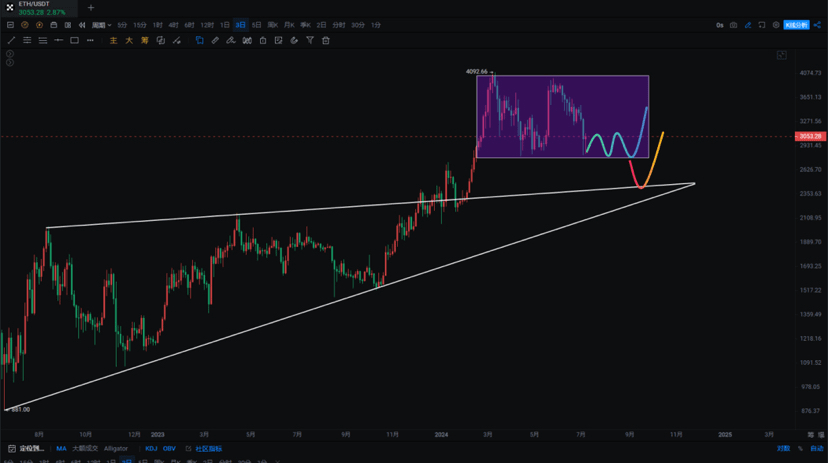
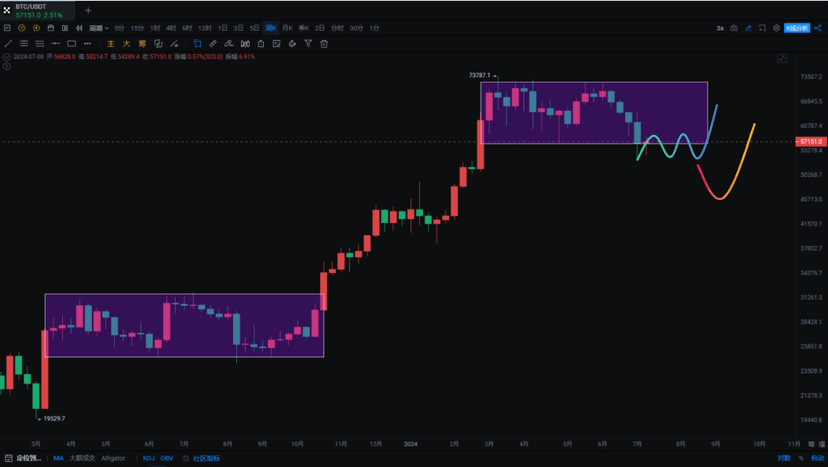
In fact, we can compare the box-shaped oscillation that lasted for half a year from April to October 2023. On August 18, it plunged downward to 24220 and then recovered and went on for nearly 2 months. At that time, it broke upward again with the expectation of BTC spot ETF. The current news and the market are somewhat similar.
The current high has been maintained for more than 4 months and fell below the 60,600 column support this month. Currently, it is testing the support of the 56,552 pin. There were two pins on the daily line and there was a short-term rebound. The daily line also showed a divergence. Yesterday, it was around 55,000 and reminded us to do a short-term trade, with the highest reaching 58,200.
The first one: To replicate the previous trend of 24900, the bottoming out time must be long enough and then there must be another decline to recover.
The second option is to continue to fall for a week or two.
Flatbread
I think it is still a downward relay reason:
The 24900 wave maintained a six-month box shock, touching the BOLL monthly line middle track under pressure but not completely suppressed
The monthly MACD turns over the zero axis and the fast and slow lines turn upward. The current column is shortening.
The monthly RSI indicator fell below the overbought zone, and KDJ turned downward.
The weekly MACD column continues to grow and the fast and slow lines continue to move downward
From the perspective of Fibonacci, the rebound must break through 0.382 (60600) to stop the decline (Ether 3255)
First grasp the short-term market: the potential bottom divergence of the daily 4-hour rebound height is around 60,600, and it will continue to fall if it cannot stand firm.
support:
pressure:
ether
There are signs of a short-term rebound near 2800 after two pins, and the daily line shows a bottom divergence. The RSI oversold area turns upward to target 3240. If it fails to break through, it will continue to fall. The 4-hour box is 2810-3080. Grasp the short-term market first.
support:
pressure: