The ordinary moving average is displayed on the main chart, but since the author prefers to perform structured analysis (hook + channel) on the main chart, the double moving average indicator on the main chart is converted into a sub-chart indicator.
The basis of the conversion is MACD. Correct the three parameters of MACD to (5,10,1), and only the bar line and the curve closely connected to the bar line will remain in the indicator chart. Adjust the color of the curve to match the background color, so that the curve can be hidden. Finally, the MACD line becomes a bar chart showing the difference between the two moving averages MA5 and MA10. As shown in the figure below:
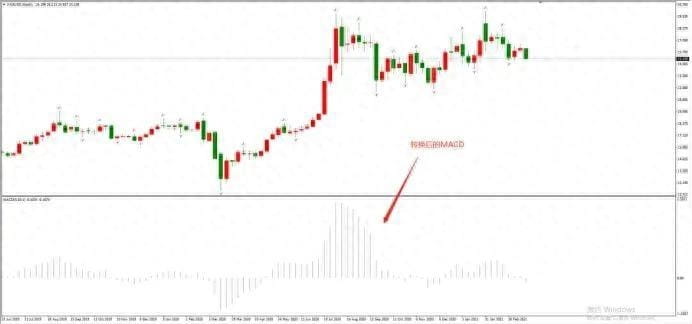
There is another important benefit to converting the main chart moving average to the secondary chart moving average.
In the main chart, the only signals that the double moving average can give are golden cross buy and death cross sell. It is impossible to give a clear indication of whether the interval between the two moving averages is expanding or shrinking.
The sub-chart moving average makes up for this deficiency. When the latest bar is greater than the previous bar, it means that the interval between the two moving averages is widening, and the trend is strengthening; when the latest bar is less than the previous bar, it means that the interval between the two moving averages is shrinking, and the trend is weakening. Through the concrete indicator of the bar, traders can more clearly judge the current trend status.
If you want to expand the double moving average to three moving averages or even more, you just need to add a new MACD indicator according to the same conversion principle.
For example, the short-term moving average I often use is (5,10). If you want to add a longer-term moving average such as MA20, you only need to add a MACD in the sub-chart, correct its parameters to (5, 20, 1), and then adjust the color of the curve to be consistent with the background. The two converted MACD indicators can build a simplest trading strategy: when the long-term MACD is above the 0 axis and the short-term MACD is below the 0 axis, buy the corresponding trading target; when the short-term MACD is above the 0 axis and the latest bar is lower than the previous bar, take profit and close the position.
RSI is an oscillating indicator that mainly gives overbought and oversold signals.
When an overbought signal appears, the market is often in a violent uptrend; when an oversold signal appears, the market is often in a violent downtrend. The default overbought range of the RSI indicator is (70~100), and the oversold range is (0~30). The range setting is relatively loose. The author often uses the overbought range of (80~100) and the oversold range of (0~20).
The parameter of RSI is 5, which is a small value and is convenient for judging short-term market fluctuations.
The following is a complete strategy consisting of two moving averages and RSI:
Buying strategy:
When the double moving average MACD is above the 0 axis and the RSI is in the overbought zone
Signal to add positions:
In the long position state, the latest bar of MACD is higher than the previous bar
Closing signal:
The latest MACD bar is lower than the previous bar
Strategy Sell:
When the double moving average MACD is below the 0 axis and the RSI is in the oversold zone.
Signal to add positions:
When a sell order is held, the absolute value of the latest MACD bar is higher than the absolute value of the previous bar.
Closing signal:
The absolute value of the latest MACD bar is lower than the absolute value of the previous bar.
This buying and selling strategy is based on trend thinking, and when there is a sustained one-sided market, it can obtain relatively sufficient profits.
When the market is experiencing a sharp rise and fall in the early stage and a rapid V-shaped reversal in the later stage, it can also help to close the position in time and avoid the floating profit turning into floating loss. However, since the market has been running for a certain period of time when the RSI reaches overbought or oversold, the entry point often does not have a clear advantage. In addition, the closing signal is set very sensitively, and the problem of premature closing may occur frequently.
Logically, there are no obvious loopholes in this strategy. However, the market trends of foreign exchange, gold, silver, and stock indexes in recent years have all been in a "one step, three turns back" mode, and there are rarely smooth markets with one wave stronger than the next. This has led to the failure of trend strategies in such a tepid market.
By swapping the buy and sell signals of the strategy, you can convert it into a buy and sell strategy based on oscillation thinking. The logical basis of the oscillation strategy is that when the RSI indicator enters the overbought or oversold zone, the market has indeed reached its end and has a clear turning point. The entry point of the oscillation strategy is often much better than that of the trend strategy, but the profit space captured is much smaller than that of the trend formation strategy. According to traditional trading logic, it is not recommended for novice traders to use oscillation thinking.


