With Bitcoin (BTC) likely at the point of rejection, the remaining cryptocurrencies could be a tough hold, at least in the short to medium term. At the top of the risk curve, memecoins are even more dangerous. PEPE and $WIF are the leaders, but are they running out of steam?
PEPE price rejected - how low can it go?

The short-term time frame chart for PEPE (PEPE/USD) shows price breaking a long-term downtrend line. After an initial rally, price has declined and is now making a number of higher highs and higher lows while following a new uptrend line.
However, the PEPE price has tagged the 0.786 Fibonacci level for this move and it seems to be getting rejected from this level at the moment. With the short-term Stochastic RSI bearish, it remains to be seen where the recovery could occur.
The rising trendline may be favored, but PEPE bulls will need to prevent the price from making lower lows, especially if it breaks below $0.00000835.
Strong support below for $PEPE

On the weekly timeframe, we can see that the price is still holding above the 0.236 Fibonacci level. If PEPE falls below this level, the 0.382 Fibonacci at $0.00000963 is a good support level below, with 0.618 and 0.786 also being strong support lines below this level.
Big boost for $WIF

The 4-hour chart for $WIF (WIF/USD) is looking good so far. The price has made a 66% gain since the breakout. The successive higher highs and lower lows do not signal any reversal. The latest minor price correction is currently struggling to hold above the 0.236 Fibonacci level at $2.73. However, if the price breaks below this level and tags the 0.382 Fibonacci level at $2.58, that would be the first lower low.
$WIF hits strong resistance on weekly chart
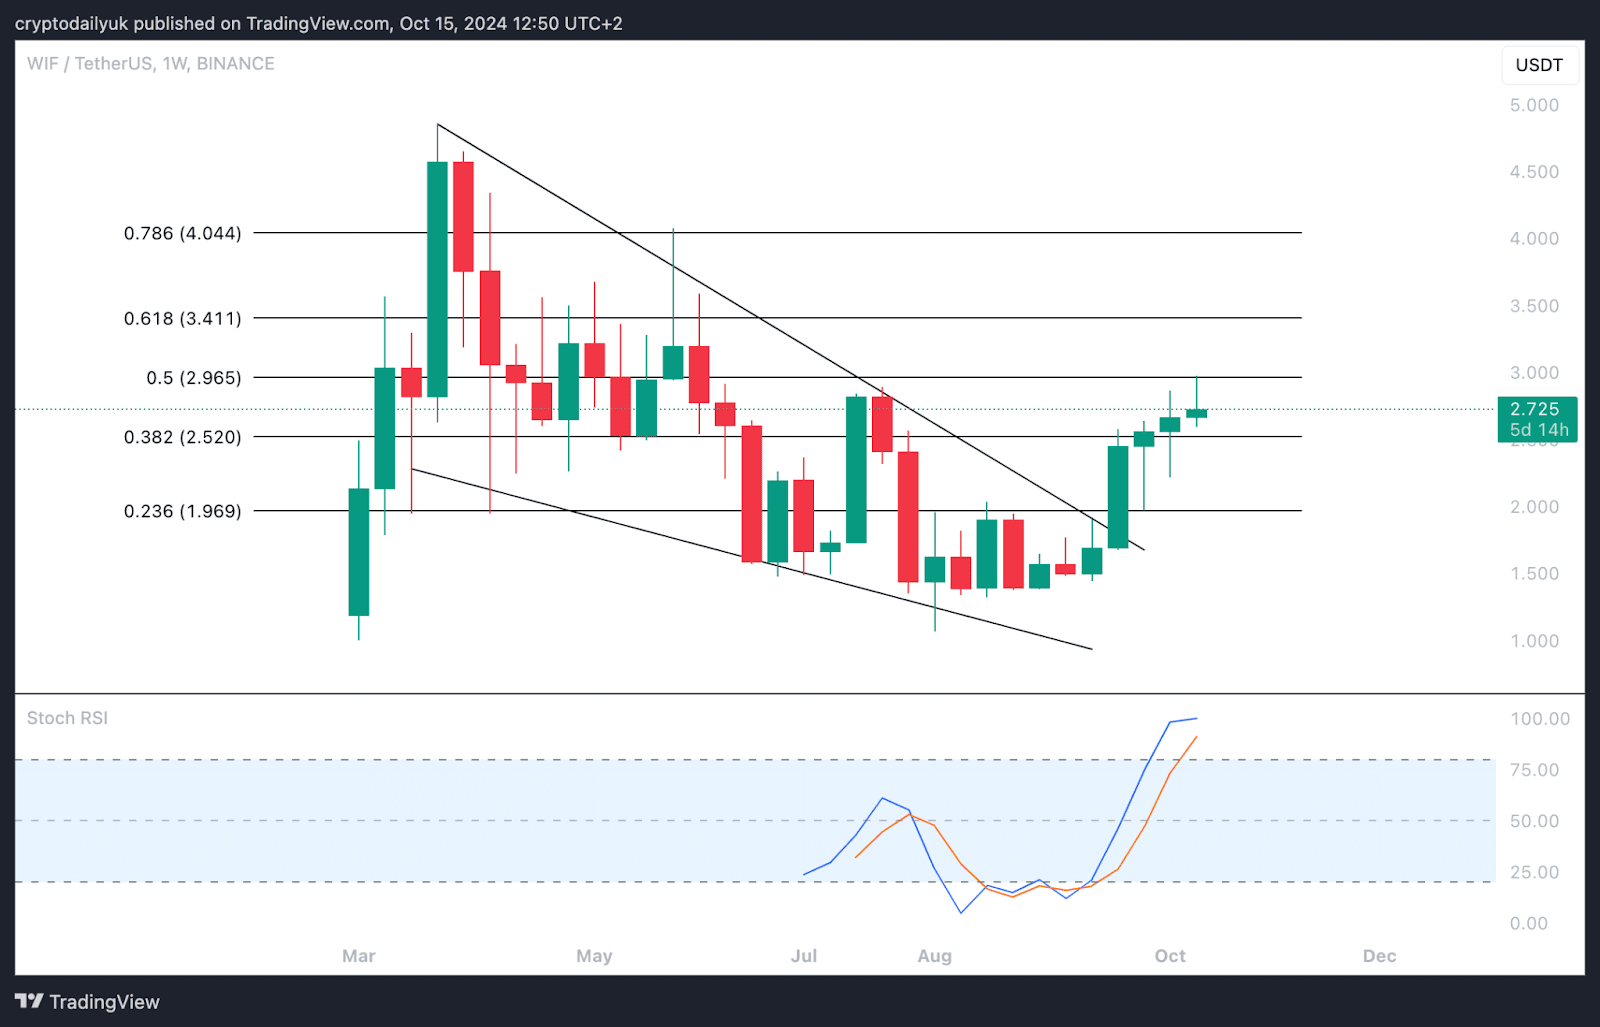
On the higher weekly timeframe, there are some concerns on the $WIF price chart. The price action shows that $WIF has hit the 0.5 Fibonacci level, which is a strong resistance level. Additionally, at the bottom of the chart, the Stochastic RSI is currently at a top. This could mean that the price is headed lower - it remains to be seen whether the price will return to the support level at $1.97.


