Bitcoin made a very strong breakthrough yesterday morning, closing with a very strong long positive line at the one-hour level, but the price quickly came to the short-term high point ahead and temporarily encountered resistance.
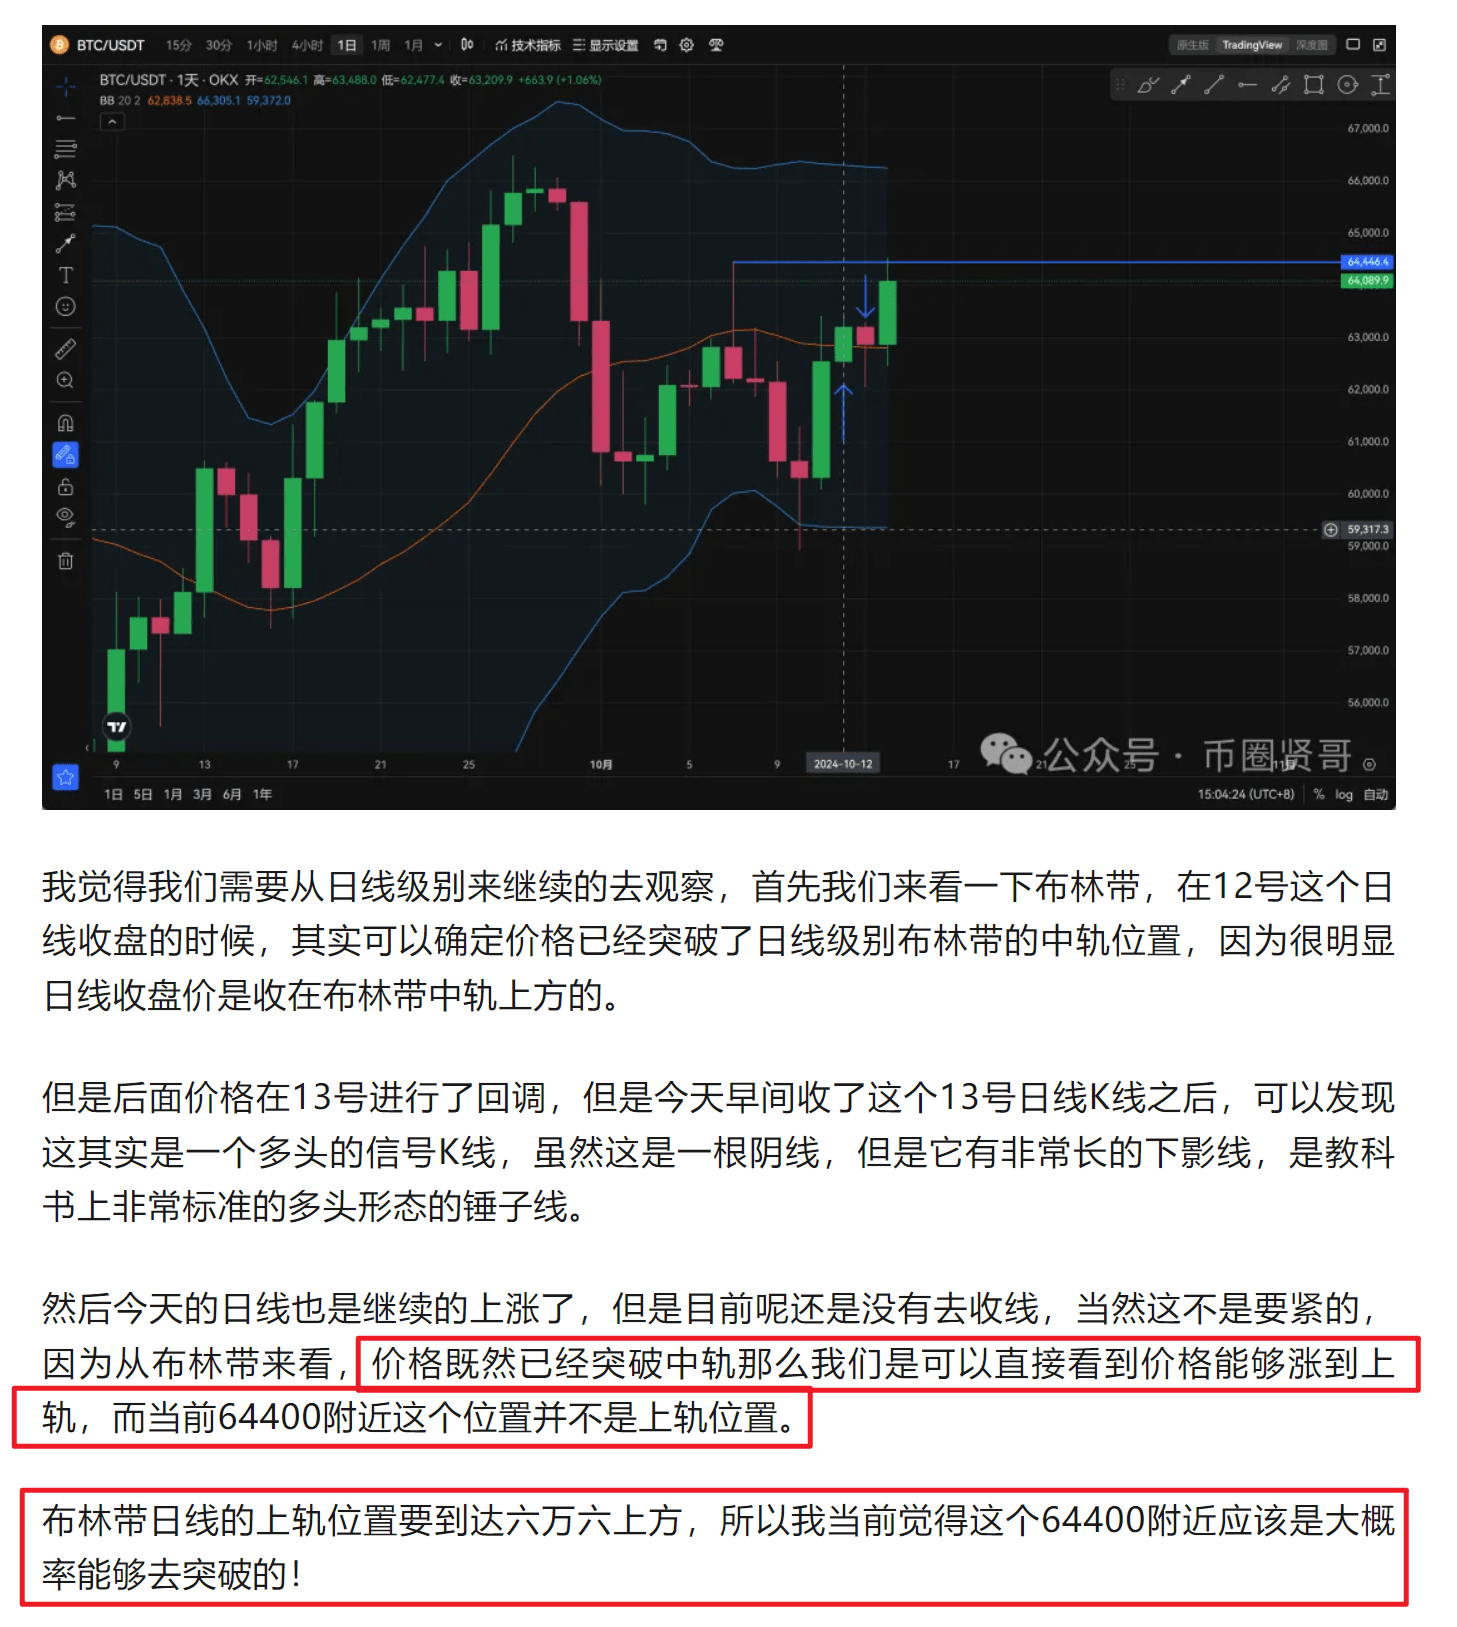
However, when we observe the resistance after the price breakthrough at that time from the daily level, we find that this is not a very critical resistance, because from the daily Bollinger Bands, in fact, the Bitcoin price has already broken through the middle track of the daily Bollinger Bands, and when the daily K-line closed on the 12th, it had already closed above the middle track of the daily Bollinger Bands.
Then the K-line of the daily line on the 13th is actually a bullish K-line, although it closed with a negative line. This was mentioned in our article yesterday. At the same time, we also saw that the upper track of the Bollinger band was around 66,000 yesterday.
So I think the price will reach the upper track of the Bollinger Band, which is 66,000. Therefore, we said yesterday with certainty that the resistance above 64,000 is likely to be broken through!

Then looking at the current market situation, after Bitcoin made a strong short-term breakthrough yesterday, the price did not begin to pause near the resistance level, but started a relatively rapid oscillating upward trend. The final price also came above 66,000, and the highest was around 66,500.
The current price encountered resistance above 66,000 and has been pulled back. Through yesterday's review and analysis, we can clearly know that the current resistance above is the upper track of the Bollinger band at the daily level, and the current price has been pulled back to around 65,300.
So can this upper resistance be broken through today?

Then I still think that the price will most likely continue to break through the resistance above 66,000, because from the daily level we can see that after yesterday's breakthrough, the MACD at the daily level has formed a golden cross trend, which is a bullish trend that has not appeared in the market for a long time!
Previously, the MACD fast and slow lines could not continue to rise when they reached a critical position, and the price therefore fell back. However, this time there is an additional golden cross trend above the zero axis at the daily level. I think this trend is what we must pay attention to next, and it may bring about a very huge rise!
Bitcoin made a very strong breakthrough yesterday morning, closing with a very strong long positive line at the one-hour level, but the price quickly came to the short-term high point ahead and temporarily encountered resistance.
However, when we observe the resistance after the price breakthrough at that time from the daily level, we find that this is not a very critical resistance, because from the daily Bollinger Bands, in fact, the Bitcoin price has already broken through the middle track of the daily Bollinger Bands, and when the daily K-line closed on the 12th, it had already closed above the middle track of the daily Bollinger Bands.
Then the K-line of the daily line on the 13th is actually a bullish K-line, although it closed with a negative line. This was mentioned in our article yesterday. At the same time, we also saw that the upper track of the Bollinger band was around 66,000 yesterday.
So I think the price will reach the upper track of the Bollinger Band, which is 66,000. Therefore, we said yesterday with certainty that the resistance above 64,000 is likely to be broken through!
Then looking at the current market situation, after Bitcoin made a strong short-term breakthrough yesterday, the price did not begin to pause near the resistance level, but started a relatively rapid oscillating upward trend. The final price also came above 66,000, and the highest was around 66,500.
The current price encountered resistance above 66,000 and has been pulled back. Through yesterday's review and analysis, we can clearly know that the current resistance above is the upper track of the Bollinger band at the daily level, and the current price has been pulled back to around 65,300.
So can this upper resistance be broken through today?
Then I still think that the price will most likely continue to break through the resistance above 66,000, because from the daily level we can see that after yesterday's breakthrough, the MACD at the daily level has formed a golden cross trend, which is a bullish trend that has not appeared in the market for a long time!
Previously, the MACD fast and slow lines could not continue to rise when they reached a critical position, and the price therefore fell back. However, this time there is an additional golden cross trend above the zero axis at the daily level. I think this trend is what we must pay attention to next, and it may bring about a very huge rise!


