
How to Use the Crypto Futures Market Page on Binance
Disclaimer: Digital asset prices can be volatile. Do your own research. See full terms here and our risk warning here and below. Binance Futures products are restricted in certain countries and to certain users. This communication is not intended for users/countries to which restrictions apply.
Main Takeaways
The Binance Crypto Futures Market page provides traders with comprehensive data to discern market dynamics and sentiment.
The information empowers traders with insights into different metrics such as open interest, long/short ratio, altcoin week index, market indices, and heatmap.
Analyzing the sentiment behind these insights can help traders make more informed decisions, better assess market conditions, and refine their trading strategies.

Crypto futures represent a contractual agreement wherein a market participant commits to buying or selling an underlying cryptocurrency asset at a predetermined price on a specified future date.
Futures contracts act as a hedging instrument, offering market participants effective ways to mitigate potential risks associated with volatile cryptocurrency prices. For instance, if an investor holds a significant amount of a particular cryptocurrency and is concerned about a potential price drop, they can enter into a short futures contract to profit from the price decline. This strategy effectively offsets potential losses in their cryptocurrency holdings.
Futures traders employ an array of tools to meticulously analyze market trends, enabling them to craft effective trading strategies and make informed decisions.
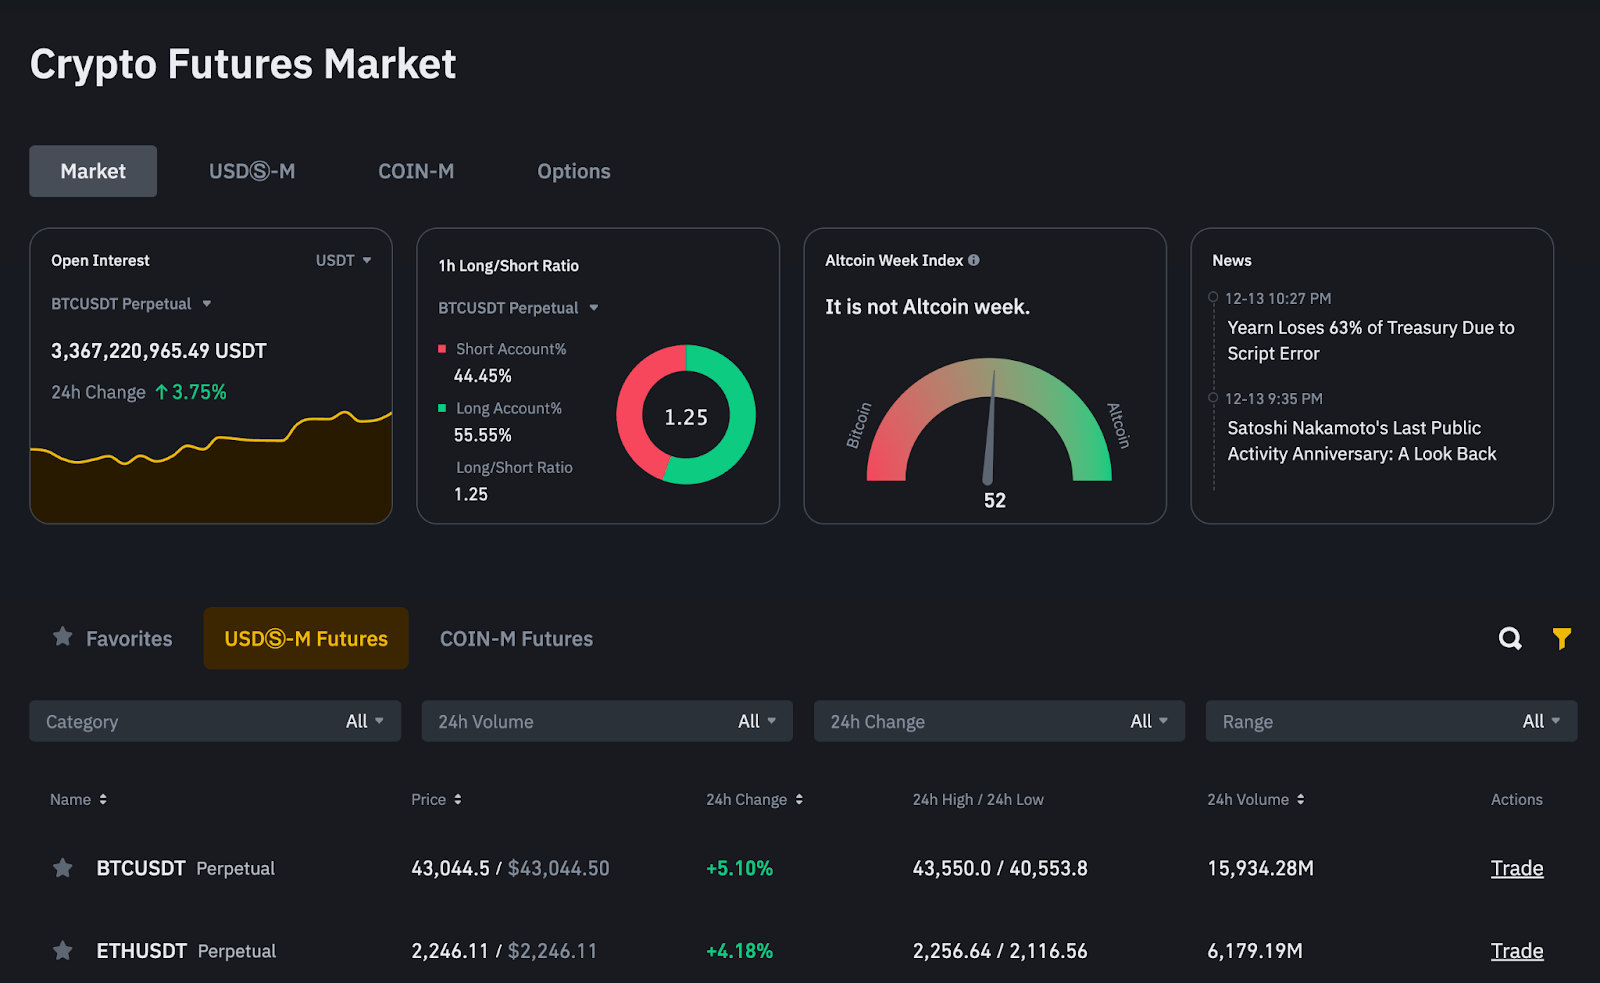
What is the Crypto Futures Market Page on Binance?
The Binance Crypto Futures Market page provides traders with comprehensive data to discern market dynamics and sentiment. Using the insights, traders can make more informed decisions, better assess market conditions, and refine their trading strategies. It empowers traders with insights into different metrics such as open interest, long/short ratio, altcoin week index, market indices, and heatmap.
This article examines the available data and discusses what traders can understand about the market from this information.
Open Interest
Open Interest (OI) in a futures market is a tool that monitors the aggregate number of open positions at any given moment in a futures contract, such as BTC perpetual. It is a metric for gauging how traders are positioned in the cryptocurrency market and their overall sentiment towards the market’s direction. Traders use the changes in open interest, volume, and price to analyze the existing market sentiment. For example, if open interest increases concurrently with asset volume and prices, it may be a clue for a potential bull run.

Open interest is calculated by summing up all the open trades in a contract and subtracting all the closed positions, regardless of long and short positions. Typically, it portrays the inflow and outflow of capital from a market. For instance, open interest increases when capital inflows into the futures market and decreases with every outflow. Therefore, it can signal a bull market when the open interest increases along with trading volume and price. A decline in open interest may indicate a bear market.
Example:
Suppose Kevin, Jillo, and Gloria are trading a BTCUSD perpetual contract. If Kevin buys 5 BTC to enter a long position, the open interest increases by 5 (+5). If Jillo opens a short position with 2 BTC, the open interest increases with another 2 (+2). However, if Gloria sells her 3 BTC to close a long position, open interest decreases by 3 (-3). Therefore, the contract’s open interest is 4.
(5 + 2) + (-3) = 4
Long/Short Ratio
The long/short ratio is an indicator that shows the proportion of net long accounts to net short accounts with positions for a particular contract. It is a common indicator of market health and direction. A high long/short ratio indicates positive investor sentiment and a potential price increase, while a low ratio signals negative investor sentiment. The ratio typically increases if there are more long positions relative to short positions.
Traders use the Binance long/short ratio to identify when prices are likely to rise or fall. For instance, as the ratio approaches a Fibonacci level and most participants are trading long, it signals a potential opportunity for a short position.

The long/short ratio is calculated by dividing the long positions by the short positions. The timeframe for this calculation ranges between 5 minutes and 24 hours. The calculations are as follows:
Long account % = Accounts with net long positions / Total Accounts with positions
Short Account % = Accounts with net short positions / Total Accounts with positions
Long/Short Ratio = Long account % / Short Account %
Example
Suppose a particular contract has a long account percentage of 69.78% and a short account percentage of 30.22%. The long/short ratio will be 2.31 (69.78% / 30.22%). This means that the long positions are 2.31 times as much as the short positions. It typically indicates an imminent bullish trend.
Altcoin Week Index
The altcoin week index is a metric that monitors the performance of Bitcoin relative to a basket of altcoins. It determines whether it is Altcoin Week or Bitcoin Week based on the index reading. It is considered a Bitcoin Week if only 25% (or less) of the top 50 altcoins perform better than Bitcoin within the last 7 days. On the contrary, it is Altcoin week if 75% (or more) of the altcoins outperform Bitcoin in the last 7 days. When the percentage lies between 25% and 75%, it measures the intensity of Altcoin Week.

The Altcoin Week Index is calculated by dividing the number of altcoins outperforming Bitcoin by the top 50 altcoins and multiplying the result by 100. Altcoin Week may typically be marked by more capital flowing into altcoin markets than towards Bitcoin. In addition, it can potentially be signaled by an increase in altcoin prices and a stable or decline in Bitcoin price.
The top 50 altcoins used in this index exclude asset-backed tokens and stablecoins like Tether. This metric gives investors greater insight into the market dynamics and direction. It signals whether to be bullish on Bitcoin or altcoins.
Example:
Let’s say the Altcoin Week Index reads 18. It means market sentiment still points towards Bitcoin since the index is below 25%. Only 18% of the top 50 altcoins have outperformed Bitcoin.
Market Index
An index is technically a tool used to track the performance of an asset (s). The resulting measurement is used to simulate the behavior of a particular market segment. In regards to this, the market index in Binance Futures is used to gauge specific market sentiments. This ranges from the NFT market, PoW blockchains, DeFi, DEX, Layer 1 and Layer 2 blockchains, metaverse, etc.

The DeFi index, for instance, measures and tracks the overall performance of the DeFi tokens and coins listed on Binance Futures. The DeFi index value is calculated by taking a weighted average of the prices of its components. These types of futures contracts take into account the changes that reflect market capitalization and volume.
Heatmap
A heatmap is a graphical representation of data that uses colors to demonstrate different values. The Binance Futures Heatmap is a visual representation of the performance of USDⓈ-M or COIN-M perpetual contracts. It automatically organizes real-time data based on price changes and multiple technical indicators using a color scheme (green, red, and gray) that reflects a decline or rise in market trends. The green means that the asset’s price is appreciating, the red signifies a decline, while the gray implies stability.
The different shades of these colors also provide investors with insight into an asset’s 24-hour price changes. For instance:
0% price change = gray
0 - 10% price change = light green/red
10 - 20% price change = green/red
20%+ price change = dark green/red

What Information Can Be Conveyed from Heatmap?
A trader can use different advanced filters to get more insight from the heatmap. These include:
Trading volume – The data blocks are organized based on volume, i.e., the bigger the block size, the higher the contract’s volume.
24h Change – The block size is based on the percentage change within the last 24 hours
Market Cap – The heatmap is organized based on the contract’s market capitalization.
The contracts are also categorized into Layer 1, Layer 2, and DeFi.
The heatmap performance index can further be filtered based on price performance indicators, RSI, volatility, and funding rates.
Price Performance Indicators
The price-performance indicator signals a cryptocurrency’s price movement, with the green color indicating rising prices and the red declining prices. The gray color means that the prices have been stable within that particular timeframe. The timeframe also ranges between 1-hour performance change to 1 month-performance change.
RSI Oscillator
The RSI indicator shows the momentum and size of a contract’s price changes within a specific period. It is used to determine whether an asset is undervalued or overvalued based on its price. A reading above 70 signals an overbought condition, while that below 30 shows an oversold condition. A deep red color indicates the RSI is above 80, and the asset is highly overbought. A deep green color shows the RSI reading is below 20, while a gray color is represented by a reading of 50.
Volatility
Volatility displays a cryptocurrency’s price fluctuation rate. It is represented by gray colors and shades of blue. For instance, when volatility is above 7%, it is represented by a dark blue color. The color’s intensity declines as the volatility reduces. The gray color shows there is 0% volatility.
Funding Rates
Funding rates (FR) refer to the payments made by long and short traders within a specific timeframe. A trader typically pays or receives funding based on their open positions. A funding rate between -0.005 and -0.01 is represented by a red color, while FR above 0.01 is indicated by deep green.
Closing Thoughts
The Binance Crypto Futures Market page can serve as a valuable tool for assessing market trends and gauging market sentiment. Nonetheless, supplementing it with additional tools to formulate more informed investment decisions and strategies can help mitigate traders with better risk management.
Further Reading
(Blog) Price Convergence and Funding Fees in Perpetual Futures Markets
(Blog) Crypto Futures Trading For Beginners: Here’s a 5-Step Plan to Get Started!
Risk Warning:
No Representation
This content is presented to you on an "as is" basis for general information and educational purposes only, without representation or warranty of any kind. It is not intended or should not be construed as financial or investment advice, nor is it to recommend or intend to recommend the purchase or sale of any specific product(s) or service(s).
Hypothetical Performance Results
Digital asset prices can be volatile. The value of your investment may go down or up, and you may not get back the amount invested. Any results posted herein are intended as examples only to provide you with a reference of what potentially could have made or lost trading with the technical indicators and tools, but are in no way a reflection of what you could have made or lost in the same situation. Therefore, you should not rely on the results as a representation of what your returns or losses would have been utilizing such technical indicators.
There are numerous other factors related to the market in general or to the implementation of any specific trading program which cannot be fully accounted for in the preparation of hypothetical performance results and all of which can adversely affect actual trading results. Past performance should not be taken as an indication or guarantee of future performance, and no representation or warranty, expressed or implied is made regarding future performance.
Futures trading, in particular, is subject to high market risk and price volatility. You may be called upon at short notice to make additional margin deposits or interest payments. If the required margin deposits or interest payments are not made within the prescribed time, your collateral may be liquidated without your consent. Moreover, you will remain liable for any resulting deficit in your account and interest charged on your account. All of your margin balance may be liquidated in the event of adverse price movement. Past performance is not a reliable predictor of future performance. Before trading, you should make an independent assessment of the appropriateness of the transaction in light of your own objectives and circumstances, including the risks and potential benefits. Consult your own advisers, where appropriate. This information should not be construed as financial or investment advice. To learn more about how to protect yourself, visit our Responsible Trading page.
Responsibilities
You are solely responsible for your investment decisions, and Binance is not liable for any losses or damages you may incur. The risk warning described herein is not exhaustive, therefore you should carefully consider your investment experience, financial situation, investment objective, risk tolerance level and consult your independent financial adviser as to the suitability of your situation prior making any investment. For more information, see our Terms of Use and Risk Warning.
The products and services referred to herein may be restricted in certain jurisdictions or regions or to certain users in accordance with applicable legal and regulatory requirements. You are solely responsible for informing yourself about and observing any restrictions and/or requirements imposed with respect to the access to and use of any products and services offered by or available through Binance in each country or region from which they are accessed by you or on your behalf.
Binance reserves the right to change, modify or impose additional restrictions with respect to the access to and use of any products and/or services offered from time to time in its sole discretion at any time without notification.