


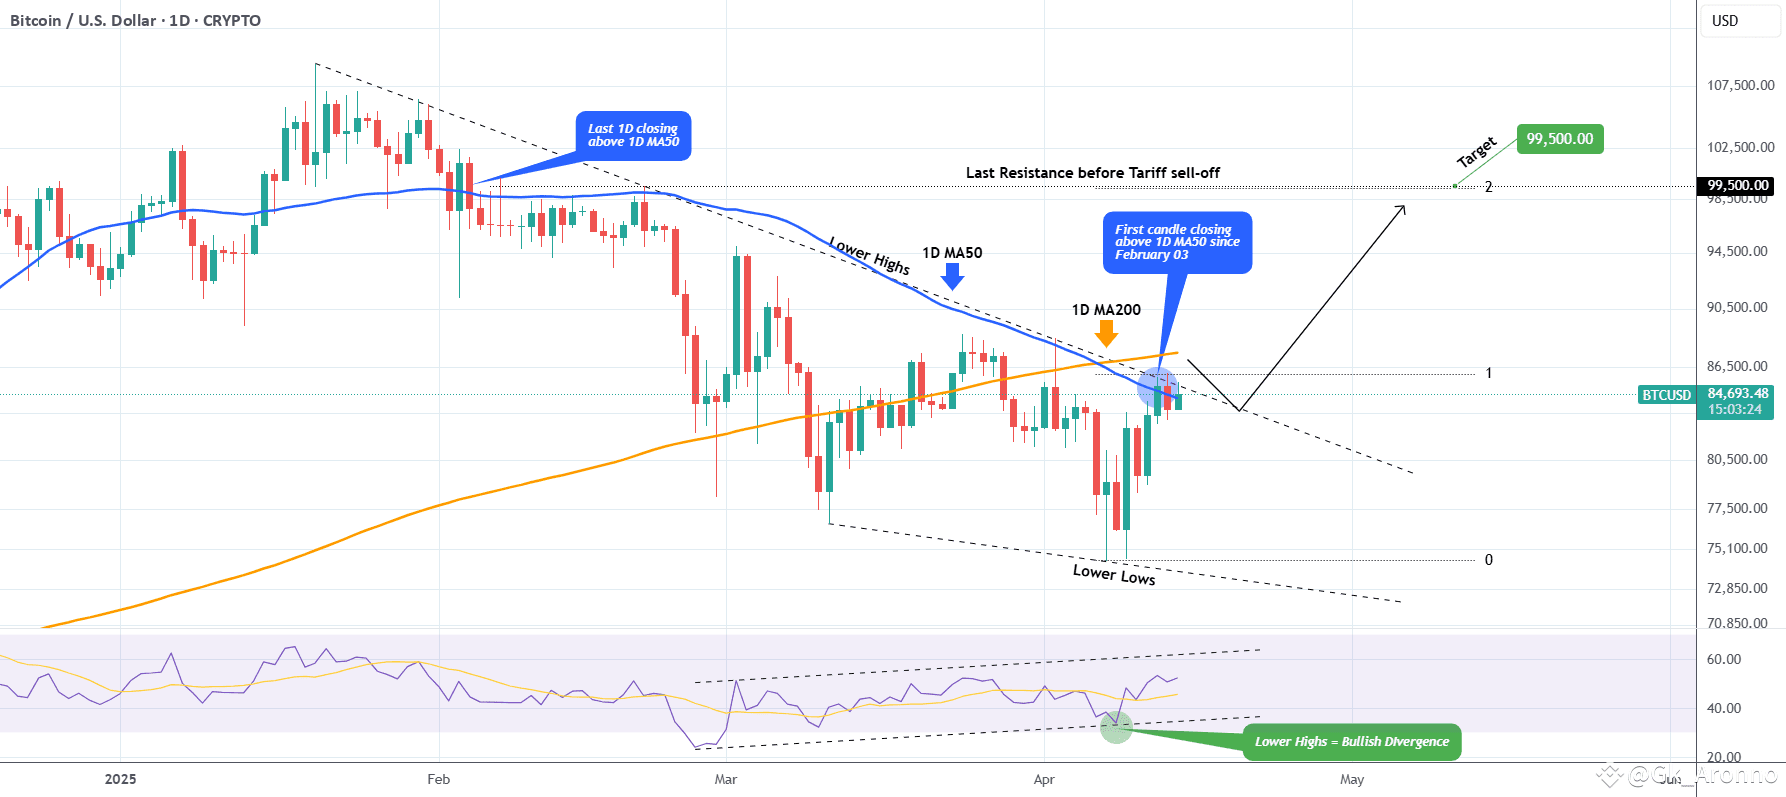
Bitcoin (BTCUSD) closed Saturday's 1D candle above the 1D MA50 (blue trend-line) for the first time in more than 2 months (since February 03)! The 1D MA50 got tested and rejected the price 6 times since then. At the same time, the price marginally broke above the Lower Highs trend-line that started on the January 20 All Time High (ATH).
This is the most powerful short-term bullish combination as it was staged on a Bullish Divergence 1D RSI, which is on Higher Lows against the bearish trend's Lower Lows. Technically such break-outs immediate Target is the 2.0 Fibonacci extension, which now happens to be just below the $100k mark at $99500. In not such a coincidental fashion, that is he last Resistance level that run through February 05 - 21 before BTC's strong tariff sell-off.
So do you think the 1D MA50 break is the green light for a $99500 rally? Feel free to let us know in the comments section below!
-------------------------------------------------------------------------------
** Please LIKE 👍, FOLLOW ✅, SHARE 🙌 and COMMENT ✍ if you enjoy this idea!