
Current Price: 0.00000705 BTCTrend:
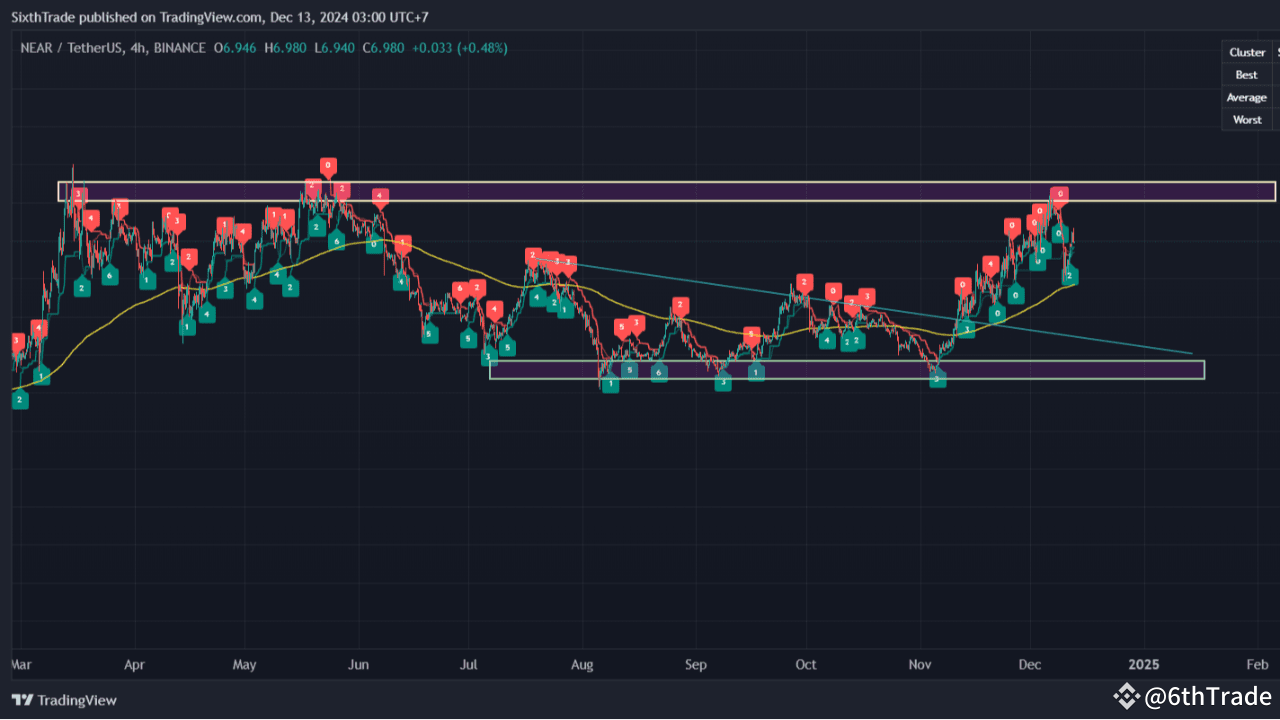
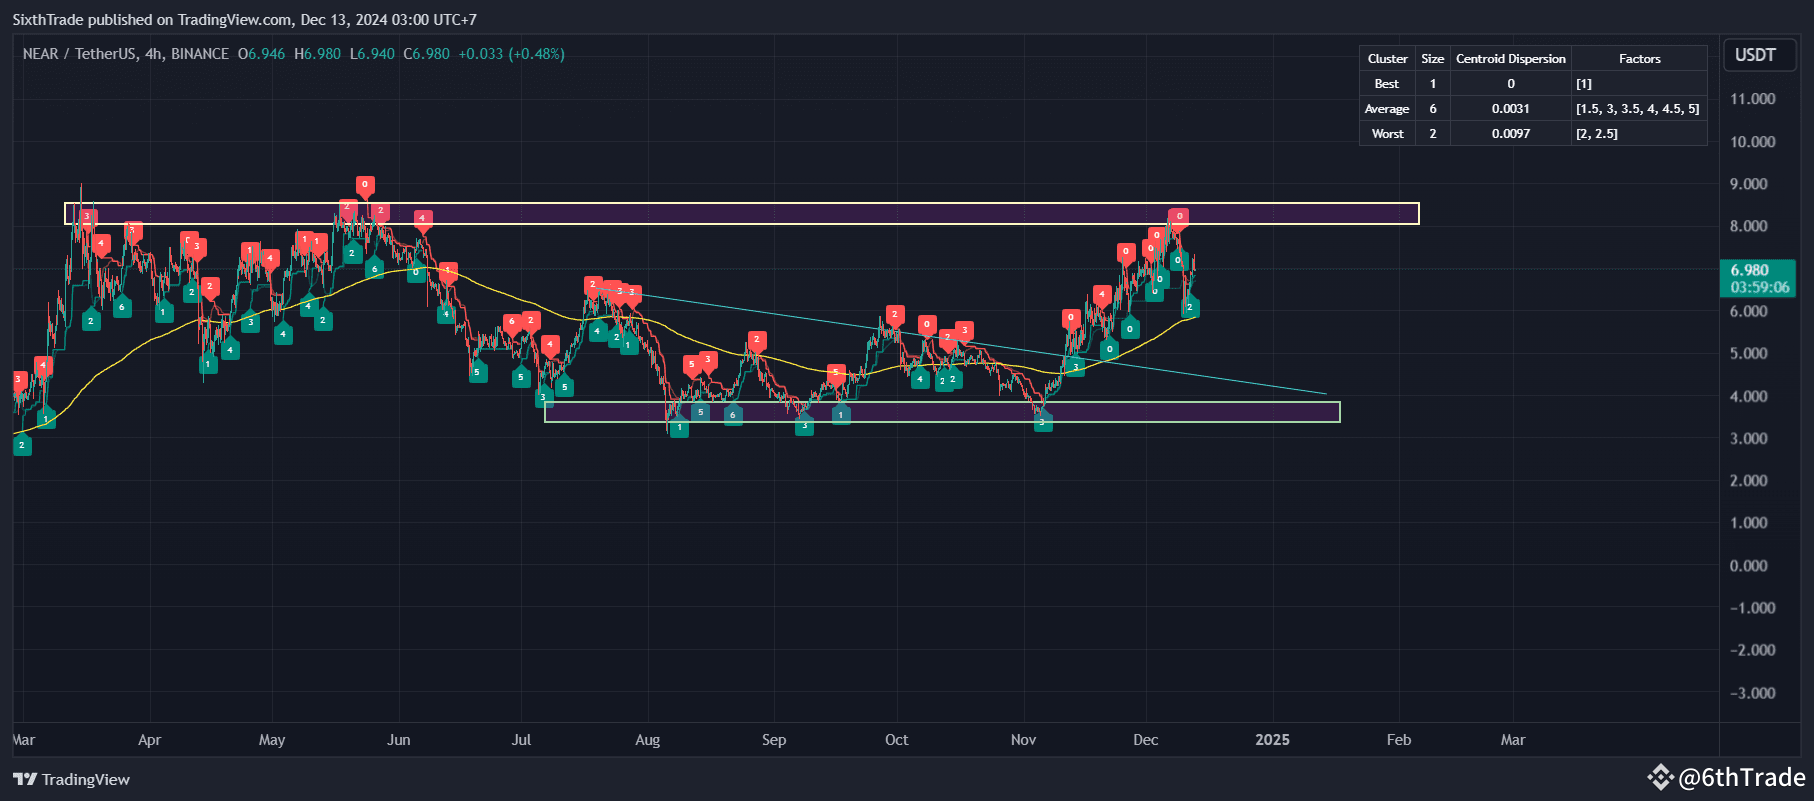
NEAR/BTC has been moving sideways for a significant period, fluctuating within a relatively tight trading range. The overall trend appears stable with occasional peaks and troughs, but no clear directional momentum has emerged recently.
Indicators Overview:
RSI (Relative Strength Index):
Value: 49.43
Condition: The RSI is in a neutral position, reflecting an equilibrium between buyers and sellers. This suggests that the market is currently undecided with no significant buying or selling pressure dominating.
MACD (Moving Average Convergence Divergence):
MACD Line: 0.00000066
Signal Line: 0.00000088
Histogram: -0.00000022
Condition: The MACD is slightly bearish with the MACD line below the signal line and a negative histogram, indicating a mild bearish sentiment or lack of strong bullish momentum.
Volume:
Average Trading Volume: 191.5
Interpretation: The trading volume has been moderate, supporting the ongoing price stability. This level of volume does not indicate strong conviction in either direction, reinforcing the current range-bound market behavior.
Key Levels:
Support Zones:
Immediate Support: 0.00000680 BTC, a level where buying interest has historically been strong enough to prevent further declines.
Major Support: 0.00000650 BTC, serving as a stronger psychological and technical barrier.
Resistance Zones:
Immediate Resistance: 0.00000750 BTC, a recent high point and a level that has consistently capped upward movements.
Higher Resistance: 0.00000800 BTC, a significant level that, if breached, could indicate a change in market sentiment towards more bullish conditions.
Scenarios:
Bullish Scenario:
Break Above 0.00000750 BTC: If the price can sustain above this immediate resistance, it might attract additional buying interest, potentially pushing the price towards the 0.00000800 BTC level.
Positive Shift in Indicators: An upward turn in the MACD and an increase in RSI above the 50 mark would provide more confidence in a potential bullish reversal.
Bearish Scenario:
Break Below 0.00000680 BTC: Dropping below this support could lead to increased selling pressure, targeting the next major support at 0.00000650 BTC.
Continued Negative MACD: If the MACD remains below the signal line and the histogram deepens, it could confirm a stronger bearish outlook.